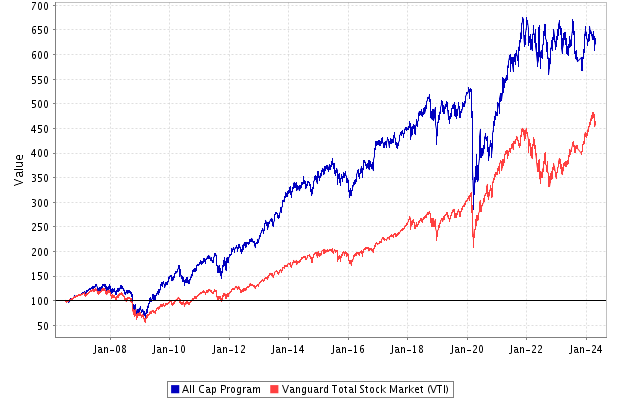
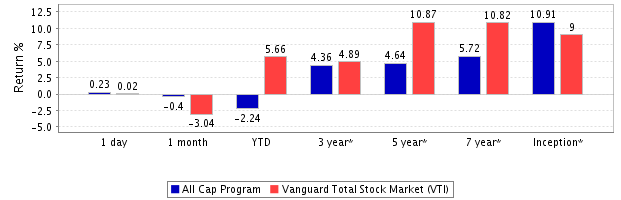
The All Cap portfolio is comprised of mechanically generated, high-quality stocks designed to outperform the S&P 1500 on a total return basis while minimizing volatility.
The portfolio is re-balanced monthly and is equally weighted across all major sectors.
A total of 33 stocks are held in the All Cap portfolio at any given time. Please note that only companies classified as a Strong Buy in our Rating System will be considered for investment.
Consult the All Cap portfolio history to check all trades since inception.
| Year | Jan | Feb | Mar | Apr | May | Jun | Jul | Aug | Sep | Oct | Nov | Dec |
|---|---|---|---|---|---|---|---|---|---|---|---|---|
| 2006 | - | - | - | - | - | - | -0.54 | 4.39 | 0.09 | 4.89 | 1.33 | 1.71 |
| 2007 | 3.32 | -0.02 | 3.21 | 3.45 | 2.34 | 0.86 | -3.5 | 1.56 | 1.04 | 5.71 | -5.57 | 1.7 |
| 2008 | -4.89 | -3.48 | 1.25 | 3.41 | 3.44 | -8.8 | 1.42 | 1.09 | -8.33 | -17.08 | -9.95 | 2.73 |
| 2009 | -5.99 | -6.15 | 5.65 | 26.75 | 5.24 | 3.57 | 6.25 | 4 | 12.78 | -5.07 | 4.11 | 8.9 |
| 2010 | -2.16 | 3.89 | 6.79 | 3.73 | -8.44 | -10.41 | 7.92 | -6.35 | 12.87 | 3.83 | 3.75 | 4.81 |
| 2011 | 1.3 | 4.41 | 0.89 | 3.37 | -1.66 | 0.83 | -2.15 | -6.84 | -11.47 | 16.93 | 1.85 | 2.66 |
| 2012 | 5.01 | 4.03 | 2.75 | 1.16 | -5.07 | 6.22 | -0.22 | 1.19 | 2.61 | -1.08 | -0.19 | 1.11 |
| 2013 | 8.69 | -0.19 | 9.14 | -3.07 | 3.12 | -2.3 | 8.22 | -3.86 | 7.36 | 5.23 | 6.11 | 0.43 |
| 2014 | -0.66 | 4.38 | 0.54 | -1.2 | 0.38 | 3.28 | -3.93 | 3.55 | -4.13 | 3.42 | 3.44 | 3.09 |
| 2015 | -2.57 | 4.34 | 0.73 | -0.41 | -0.26 | 2.81 | -3.61 | -2.32 | -5.52 | 4.35 | 2.66 | -4.36 |
| 2016 | -4.5 | 0.72 | 4.17 | 4.74 | -0.18 | 2.06 | 3.41 | -1.22 | 1.85 | -2.56 | 9.04 | 2.66 |
| 2017 | -0.31 | 1.62 | -0.09 | 2.01 | -2.65 | 1.42 | 0.81 | -2.9 | 4.98 | 1.36 | 1.48 | -0.32 |
| 2018 | 2.68 | -4.65 | 1.49 | 2.2 | 4.76 | 0.28 | 1.82 | 4.75 | 0.48 | -8.95 | 4.04 | -9.51 |
| 2019 | 9.47 | 4.19 | -3.02 | 2.32 | -7.8 | 6.71 | 1.86 | -3.62 | 0.95 | 0.82 | 2.25 | 4.3 |
| 2020 | -2.4 | -7.41 | -27.45 | 12.59 | 0.15 | 5.91 | 0.96 | 2.97 | -6.99 | 0.24 | 14.85 | 5.5 |
| 2021 | 0.16 | 5.4 | 5.48 | 2.27 | 7.14 | 1.2 | -0.16 | 1.99 | 0.86 | 5.5 | -3.5 | 5.92 |
| 2022 | -3.81 | -0.7 | 2.42 | -6.57 | 7.85 | -7.83 | 8.44 | -4.96 | -8.89 | 11.73 | 3.44 | -3.4 |
| 2023 | 4.37 | -2.13 | 0.24 | -1.18 | -5.58 | 5.54 | 5.74 | -10.25 | -2.15 | - | 1.3 | 9.03 |
| 2024 | -1.81 | 2.11 | -0.19 | -2.31 | - | - | - | - | - | - | - | - |


Click the following link to watch the tutorial about how to use the model stock portfolios:
Please note that all recommendations are based on our model's results and do not represent our personal opinion. The stock Rating process is purely mechanical.
All analysis relies on publicly available financial information. Learn More