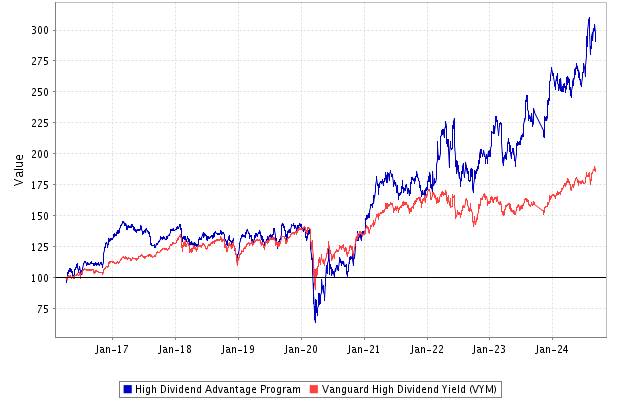
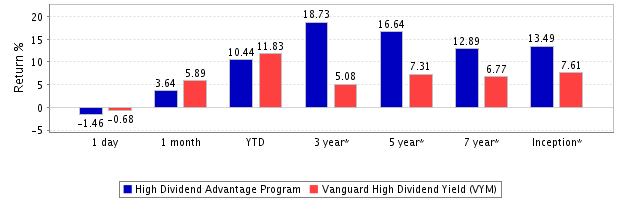
The Super Stock Screener High Dividend Advantage Stock Portfolio is the best source for easily finding the top dividend paying stocks. We employ a time-tested strategy that ensures only the best companies are included in the portfolio. Here’s a list of our trading rules:
Rule #1: The stock’s dividend yield must rank in the top 33% among all companies trading in the U.S. Investors can benefit from an income stream on top of the capital gains that come with investing in each company.
Rule #2: For all the stocks that meet the criteria for rule #1 above, calculate the Dividend Payout Ratio (dividends paid / net income). Its payout ratio must be in the bottom 15%. This means we are only keeping companies that can easily afford to pay dividends, and still have plenty of cash left over to run their business.
Rule #3: The stocks must be ranked as a Strong Buy by our Rating System. This ensure that we are investing in good companies whose stocks have strong potential to outperform the market. Our Rating System’s picks have substantially outperformed the market since we launched our service in 2007.
The portfolio is rebalanced monthly. For diversification purposes, it typically holds between 15-20 stocks at a time.
See all past trades for the High Dividend Advantage portfolio since inception.
| Year | Jan | Feb | Mar | Apr | May | Jun | Jul | Aug | Sep | Oct | Nov | Dec |
|---|---|---|---|---|---|---|---|---|---|---|---|---|
| 2016 | - | - | - | 4.83 | 0.16 | -2.13 | 5.13 | -0.1 | -0.7 | -1.04 | 15.54 | 5.24 |
| 2017 | 2.54 | 5.96 | -1.71 | -0.64 | -1.92 | -1.57 | 0.36 | -7.55 | 3.17 | 0.7 | 3.92 | 1.64 |
| 2018 | 0.56 | -6.79 | -1.14 | -1.84 | 4.14 | -0.55 | 2.57 | 1.22 | 0.14 | -4.42 | 0.96 | -8.9 |
| 2019 | 12.42 | 0.89 | -4.61 | 5.48 | -7.53 | 6.74 | 2.66 | -4.99 | 5.36 | -1.41 | 3.88 | 0.81 |
| 2020 | -8.52 | -12.34 | -32.29 | 26.88 | 5.7 | 2.42 | 0.18 | 4.57 | -3.97 | 4.31 | 16.48 | 5.2 |
| 2021 | 8.54 | 8.03 | 8.37 | 2.36 | 2.95 | -4.1 | -4.26 | 4.06 | 0.72 | 3.26 | -9.04 | 4.39 |
| 2022 | -1.85 | 14.8 | 10.97 | -4.47 | 8.03 | -14.37 | 0.65 | -6.19 | -3.32 | 10.89 | 3.06 | 0.55 |
| 2023 | 11.89 | 0.1 | -10.15 | 2.52 | -8.03 | 11.93 | 14.84 | -6.76 | 2.75 | - | -1.52 | 14.34 |
| 2024 | -2.44 | -0.97 | 3.25 | -2.72 | 4.64 | 1.98 | 13.47 | -1.59 | -4.5 | - | - | - |


Click the following link to watch the tutorial about how to use the model stock portfolios:
Please note that all recommendations are based on our model's results and do not represent our personal opinion. The stock Rating process is purely mechanical.
All analysis relies on publicly available financial information. Learn More