| Name | 1 Day | 1 Month | YTD | 3 Year* | 5 Year* | 7 Year* | Incep.* |
|---|---|---|---|---|---|---|---|
| Small Cap | -0.25% | 2.94% | 0.81% | 8.8% | 15.44% | 14.54% | 17.86% |
| iShares Russell 2000 (IWM) | -0.50% | 4.81% | 5.59% | -2.4% | 7.08% | 6.19% | 6.81% |
| Name | 1 Day | 1 Month | YTD | 3 Year* | 5 Year* | 7 Year* | Incep.* |
|---|---|---|---|---|---|---|---|
| Mid Cap | -0.89% | 3.81% | 6.22% | 5.48% | 5.19% | 4.05% | 8.48% |
| SPDR S&P MidCap 400 (MDY) | -0.68% | 4.09% | 7.46% | 2.69% | 9.33% | 8.24% | 8.39% |
| Name | 1 Day | 1 Month | YTD | 3 Year* | 5 Year* | 7 Year* | Incep.* |
|---|---|---|---|---|---|---|---|
| Large Cap | -1.48% | 5.21% | 2.69% | 3.58% | 6.53% | 6.99% | 11% |
| SPDR S&P 500 (SPY) | -0.24% | 6.23% | 15.63% | 6.65% | 13.04% | 12.16% | 9.37% |
| Name | 1 Day | 1 Month | YTD | 3 Year* | 5 Year* | 7 Year* | Incep.* |
|---|---|---|---|---|---|---|---|
| All Cap | -0.90% | 4.01% | 3.29% | 3.48% | 6.56% | 7.02% | 11.01% |
| Vanguard Total Stock Market (VTI) | -0.31% | 6.18% | 14.21% | 4.96% | 12.31% | 11.52% | 9.28% |
| Name | 1 Day | 1 Month | YTD | 3 Year* | 5 Year* | 7 Year* | Incep.* |
|---|---|---|---|---|---|---|---|
| High Dividend Advantage | -1.46% | 3.64% | 10.44% | 18.73% | 16.64% | 12.89% | 13.49% |
| Vanguard High Dividend Yield (VYM) | -0.68% | 5.89% | 11.83% | 5.08% | 7.31% | 6.77% | 7.61% |
All 5 portfolios consist of high-quality stocks designed to outperform their respective benchmarks with lower volatility.
The Small Cap, Mid Cap and Large Cap portfolios are equally weighted across all major sectors to reduce risk. They are each comprised of 11 stocks and are rebalanced monthly. The All Cap portfolio is made up of stocks from Large, Mid and Small Cap portfolios for increased diversification. Only companies classified as a Strong Buy in our Rating System will be considered for investment.
As its name suggests, the High Dividend Advantage Portfolio focuses on stocks with a high dividend yield that also have a low dividend payout ratio (implying the company can easily afford to pay dividends to shareholders). In addition, all stocks in the portfolio must be rated as a Strong Buy by our proven Rating System. This portfolio is rebalanced monthly and can hold up to 20 stocks at a time.
To access the current holdings in each portfolio and be advised of future changes, please register here.
We provide historical performance for each portfolio. Note that prior to July 2006, performance relies on historical testing; subsequent returns are based on real-time recommendations.
To learn more about the model behind the Super Stock Screener Rating System, and its track record, read our Rating System's Methodology.
Simply follow our model portfolios to in order to beat the market in any condition - bull or bear market. For example, click the following link to see how our small cap portfolio has regained its value much faster than the broad market during the last two largest market meltdowns (2008 and 2011): How Our Small Cap Portfolio Beat the Market in 2008 and 2011.

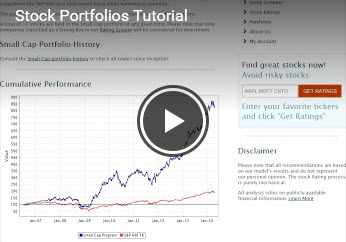
Click the following link to watch the tutorial about how to use the model stock portfolios:
Please note that all recommendations are based on our model's results and do not represent our personal opinion. The stock Rating process is purely mechanical.
All analysis relies on publicly available financial information. Learn More