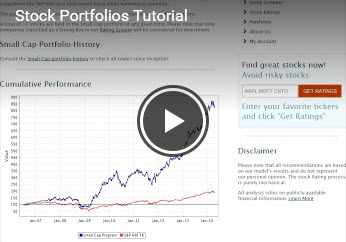
The Small Cap portfolio is comprised of mechanically generated, high-quality stocks designed to outperform the S&P 600 on a total return basis while minimizing volatility.
The portfolio is re-balanced monthly and is equally weighted across all major sectors.
A total of 11 stocks are held in the Small Cap portfolio at any given time. Please note that only companies classified as a Strong Buy in our Rating System will be considered for investment.

| Company Name | Ticker | Buy Date | Buy Price | Sell Date | Sell Price | Profit / Loss |
|---|---|---|---|---|---|---|
| Adecoagro SA | AGRO | 2022-04-04 | 11.77 | 2022-07-05 | 8.13 | -30.93% |
| RadNet Inc. | RDNT | 2022-03-01 | 22.91 | 2022-06-03 | 19.91 | -13.09% |
| Navios Maritime Partners L.P. | NMM | 2022-03-01 | 31.62 | 2022-06-03 | 31.22 | -1.27% |
| Alliance Resource Partners, L. | ARLP | 2021-09-09 | 9.42 | 2022-06-03 | 20.92 | 122.08% |
| John B. Sanfilippo & Son, Inc. | JBSS | 2022-04-04 | 85.28 | 2022-05-03 | 74.42 | -12.73% |
| Carriage Services, Inc. | CSV | 2022-03-01 | 49.89 | 2022-04-04 | 52.33 | 4.89% |
| SpartanNash Co | SPTN | 2021-11-01 | 23.44 | 2022-04-04 | 33.32 | 42.15% |
| Varex Imaging Corp | VREX | 2022-01-03 | 31.91 | 2022-03-01 | 23.66 | -25.85% |
| MarineMax Inc | HZO | 2022-01-03 | 58.86 | 2022-03-01 | 45.77 | -22.24% |
| Standard Motor Products, Inc. | SMP | 2022-01-03 | 52.39 | 2022-03-01 | 43.48 | -17.01% |
| Transcat, Inc. | TRNS | 2022-01-03 | 90.92 | 2022-03-01 | 76.31 | -16.07% |
| AdvanSix Inc | ASIX | 2021-07-06 | 28.27 | 2022-03-01 | 39.5 | 39.72% |
| Veritex Holdings Inc | VBTX | 2021-09-09 | 35.91 | 2022-02-01 | 40.38 | 12.45% |
| International Money Express In | IMXI | 2021-09-09 | 17.89 | 2022-01-03 | 16.39 | -8.38% |
| Inogen Inc | INGN | 2021-09-09 | 50.33 | 2022-01-03 | 34.23 | -31.99% |
| Tecnoglass Inc | TGLS | 2021-04-05 | 12.19 | 2022-01-03 | 26.24 | 115.26% |
| Magic Software Enterprises Ltd | MGIC | 2021-03-01 | 16.16 | 2022-01-03 | 21.65 | 33.97% |
| Smith & Wesson Brands Inc | SWBI | 2020-11-02 | 17.31 | 2022-01-03 | 18.09 | 4.51% |
| John B. Sanfilippo & Son, Inc. | JBSS | 2021-06-02 | 93.04 | 2021-11-01 | 85.07 | -8.57% |
| Navigator Holdings Ltd | NVGS | 2021-08-03 | 9.34 | 2021-09-09 | 8.87 | -5.03% |
| PAE Inc | PAE | 2021-08-03 | 8.66 | 2021-09-09 | 6.38 | -26.33% |
| Apollo Investment Corp. | AINV | 2021-07-06 | 13.86 | 2021-09-09 | 13.69 | -1.23% |
| Triple-S Management Corp. | GTS | 2021-04-05 | 26.51 | 2021-09-09 | 35.38 | 33.46% |
| BGC Partners, Inc. | BGCP | 2020-09-01 | 2.56 | 2021-09-09 | 5.07 | 98.05% |
| Sprague Resources LP | SRLP | 2021-07-06 | 25.62 | 2021-08-03 | 25.9 | 1.09% |
| Luxfer Holdings PLC | LXFR | 2021-05-03 | 22.28 | 2021-08-03 | 20.53 | -7.85% |
| Westlake Chemical Partners LP | WLKP | 2021-06-02 | 27.03 | 2021-07-06 | 27.1 | 0.26% |
| Bain Capital Specialty Finance | BCSF | 2021-06-02 | 16.01 | 2021-07-06 | 15.47 | -3.37% |
| Alliance Resource Partners, L. | ARLP | 2020-12-01 | 4.44 | 2021-07-06 | 6.97 | 56.98% |
| BlackRock TCP Capital Corp | TCPC | 2021-04-05 | 14.17 | 2021-06-02 | 14.84 | 4.73% |
| American Vanguard Corp. | AVD | 2021-04-05 | 20.9 | 2021-06-02 | 17.71 | -15.26% |
| Adecoagro SA | AGRO | 2021-03-01 | 8.34 | 2021-06-02 | 11.21 | 34.41% |
| Heidrick & Struggles Internati | HSII | 2021-04-05 | 36.85 | 2021-05-03 | 43.45 | 17.91% |
| Community Trust Bancorp, Inc. | CTBI | 2021-03-01 | 41.95 | 2021-04-05 | 44.87 | 6.96% |
| Quanex Corporation | NX | 2021-02-01 | 22.97 | 2021-04-05 | 27.14 | 18.15% |
| MYR Group Inc | MYRG | 2021-02-01 | 56.53 | 2021-04-05 | 74.34 | 31.51% |
| Westlake Chemical Partners LP | WLKP | 2021-01-04 | 22.54 | 2021-04-05 | 24.72 | 9.67% |
| Hanger Inc | HNGR | 2020-09-01 | 19.22 | 2021-04-05 | 24.02 | 24.97% |
| Bain Capital Specialty Finance | BCSF | 2020-12-01 | 12.19 | 2021-03-01 | 14.63 | 20.02% |
| MGP Ingredients, Inc. | MGPI | 2020-11-02 | 40.63 | 2021-03-01 | 66.2 | 62.93% |
| Endurance International Group | EIGI | 2020-09-01 | 6.21 | 2021-03-01 | 9.49 | 52.82% |
| Systemax Inc. | SYX | 2020-11-02 | 29.21 | 2021-02-01 | 42.15 | 44.3% |
| Lumber Liquidators Holdings In | LL | 2020-09-01 | 24.68 | 2021-02-01 | 28.07 | 13.74% |
| Myers Industries, Inc. | MYE | 2020-12-01 | 17.36 | 2021-01-04 | 20.51 | 18.15% |
| BrightSphere Investment Group | BSIG | 2020-10-05 | 13.58 | 2020-12-01 | 17.74 | 30.63% |
| FutureFuel Corp. | FF | 2020-09-01 | 12.31 | 2020-12-01 | 12.6 | 2.36% |
| Westlake Chemical Partners LP | WLKP | 2020-09-01 | 20.11 | 2020-12-01 | 21.25 | 5.67% |
| Consolidated Communications Ho | CNSL | 2020-09-01 | 7.68 | 2020-11-02 | 4.61 | -39.97% |
| Green Brick Partners Inc | GRBK | 2020-09-01 | 15.03 | 2020-11-02 | 17.7 | 17.76% |
| Echo Global Logistics, Inc. | ECHO | 2020-08-03 | 25.01 | 2020-11-02 | 27.16 | 8.6% |
| Kearny Financial Corp. | KRNY | 2020-04-03 | 7.63 | 2020-10-05 | 7.64 | 0.13% |
| QuinStreet Inc | QNST | 2020-08-03 | 11.9 | 2020-09-01 | 12.79 | 7.48% |
| TechTarget Inc | TTGT | 2020-07-06 | 30.28 | 2020-09-01 | 41.93 | 38.47% |
| America's Car-Mart, Inc. | CRMT | 2020-07-06 | 89.29 | 2020-09-01 | 102.79 | 15.12% |
| Kaiser Aluminum Corp. | KALU | 2020-07-06 | 71.26 | 2020-09-01 | 64.45 | -9.56% |
| U.S. Physical Therapy, Inc. | USPH | 2020-06-01 | 74.88 | 2020-09-01 | 88.78 | 18.56% |
| Dime Community Bancshares, Inc | DCOM | 2019-11-05 | 19.86 | 2020-09-01 | 12.96 | -34.74% |
| Sapiens International Corporat | SPNS | 2019-09-03 | 17.76 | 2020-09-01 | 34.52 | 94.37% |
| Baytex Energy Corp (USA) | BTE | 2019-06-03 | 1.55 | 2020-09-01 | 0.49 | -68.39% |
| Systemax Inc. | SYX | 2020-06-01 | 20.59 | 2020-08-03 | 23.04 | 11.9% |
| Sleep Number Corp | SNBR | 2020-05-04 | 29.54 | 2020-08-03 | 46.72 | 58.16% |
| Buckle Inc | BKE | 2020-06-01 | 14.22 | 2020-07-06 | 16.81 | 18.21% |
| Materion Corp | MTRN | 2020-04-03 | 35.09 | 2020-07-06 | 60.13 | 71.36% |
| Nextgen Healthcare Inc | NXGN | 2020-02-03 | 13.99 | 2020-07-06 | 11.1 | -20.66% |
| Douglas Dynamics, Inc. | PLOW | 2020-04-03 | 32.97 | 2020-06-01 | 36.1 | 9.49% |
| Cooper Tire & Rubber Co | CTB | 2020-04-03 | 15.9 | 2020-06-01 | 25.22 | 58.62% |
| Hanger Inc | HNGR | 2019-11-05 | 22.98 | 2020-06-01 | 17.78 | -22.63% |
| Standard Motor Products, Inc. | SMP | 2020-04-03 | 37.12 | 2020-05-04 | 38.21 | 2.94% |
| Tutor Perini Corp | TPC | 2019-12-02 | 15.04 | 2020-04-03 | 6.43 | -57.25% |
| Interface, Inc. | TILE | 2019-12-02 | 16.87 | 2020-04-03 | 6.74 | -60.05% |
| National CineMedia, Inc. | NCMI | 2019-11-05 | 7.05 | 2020-04-03 | 2.33 | -66.95% |
| Horizon Bancorp Inc | HBNC | 2019-09-03 | 15.98 | 2020-04-03 | 9.04 | -43.43% |
| Myers Industries, Inc. | MYE | 2018-06-04 | 20.65 | 2020-04-03 | 9.07 | -56.08% |
| CTS Corporation | CTS | 2019-11-05 | 27.49 | 2020-02-03 | 29.7 | 8.04% |
| Foundation Building Materials | FBM | 2019-09-03 | 16.45 | 2019-12-02 | 20.58 | 25.11% |
| Wesco Aircraft Holdings Inc | WAIR | 2019-06-03 | 10.1 | 2019-12-02 | 10.97 | 8.61% |
| Ethan Allen Interiors Inc. | ETH | 2019-07-01 | 21.16 | 2019-11-05 | 19.78 | -6.52% |
| AngioDynamics, Inc. | ANGO | 2019-05-01 | 20.3 | 2019-11-05 | 15.12 | -25.52% |
| Extreme Networks, Inc | EXTR | 2019-04-01 | 7.69 | 2019-11-05 | 6.76 | -12.09% |
| First Financial Corp | THFF | 2018-04-02 | 41.55 | 2019-11-05 | 45.08 | 8.5% |
| ePlus Inc | PLUS | 2019-08-05 | 72.96 | 2019-09-03 | 78.97 | 8.24% |
| Office Depot, Inc. | ODP | 2019-06-03 | 1.97 | 2019-09-03 | 1.24 | -37.06% |
| United Community Financial Cor | UCFC | 2019-04-01 | 9.45 | 2019-09-03 | 9.56 | 1.16% |
| Sapiens International Corporat | SPNS | 2019-06-03 | 15.88 | 2019-08-05 | 16.77 | 5.6% |
| Shoe Carnival, Inc. | SCVL | 2019-02-04 | 36.34 | 2019-07-01 | 27.86 | -23.34% |
| Ruth's Hospitality Group, Inc. | RUTH | 2019-04-01 | 25.27 | 2019-06-03 | 23.11 | -8.55% |
| Perficient, Inc. | PRFT | 2019-04-01 | 27.71 | 2019-06-03 | 30.18 | 8.91% |
| Douglas Dynamics, Inc. | PLOW | 2019-04-01 | 38.3 | 2019-06-03 | 36.87 | -3.73% |
| Northern Oil & Gas, Inc. | NOG | 2019-01-02 | 2.45 | 2019-06-03 | 1.99 | -18.78% |
| Hanger Inc | HNGR | 2019-04-01 | 19.19 | 2019-05-01 | 19.86 | 3.49% |
| Donnelley Financial Solutions | DFIN | 2019-03-01 | 14.67 | 2019-04-01 | 15.05 | 2.59% |
| Haverty Furniture Companies, Inc | HVT | 2019-02-04 | 20.58 | 2019-04-01 | 22.98 | 11.66% |
| Cohu, Inc. | COHU | 2019-02-04 | 17.62 | 2019-04-01 | 15.13 | -14.13% |
| RadNet Inc. | RDNT | 2019-02-04 | 13.85 | 2019-04-01 | 12.42 | -10.32% |
| Western Asset Mortgage Capital | WMC | 2019-02-04 | 9.9 | 2019-04-01 | 10.26 | 3.64% |
| Adecoagro SA | AGRO | 2018-12-03 | 7.0 | 2019-04-01 | 6.81 | -2.71% |
| Blue Bird Corp | BLBD | 2018-11-05 | 18.91 | 2019-03-01 | 19.0 | 0.48% |
| QuinStreet Inc | QNST | 2019-01-02 | 16.13 | 2019-02-04 | 19.38 | 20.15% |
| Quantenna Communications Inc | QTNA | 2019-01-02 | 14.24 | 2019-02-04 | 15.13 | 6.25% |
| ePlus Inc | PLUS | 2019-01-02 | 70.08 | 2019-02-04 | 79.53 | 13.48% |
| Ruth's Hospitality Group, Inc. | RUTH | 2018-12-03 | 24.4 | 2019-02-04 | 22.8 | -6.56% |
| Hanger Inc | HNGR | 2018-11-05 | 19.94 | 2019-02-04 | 20.87 | 4.66% |
| Fiesta Restaurant Group Inc | FRGI | 2018-12-03 | 19.28 | 2019-01-02 | 15.79 | -18.1% |
| Perficient, Inc. | PRFT | 2018-11-05 | 25.29 | 2019-01-02 | 22.11 | -12.57% |
| Lattice Semiconductor Corp | LSCC | 2018-11-05 | 5.92 | 2019-01-02 | 6.96 | 17.57% |
| W&T Offshore, Inc. | WTI | 2018-04-02 | 4.16 | 2019-01-02 | 4.46 | 7.21% |
| SpartanNash Co | SPTN | 2018-11-05 | 18.63 | 2018-12-03 | 18.89 | 1.4% |
| Briggs & Stratton Corporation | BGG | 2018-06-04 | 18.56 | 2018-12-03 | 14.98 | -19.29% |
| Marine Products Corp. | MPX | 2018-02-05 | 13.19 | 2018-12-03 | 22.32 | 69.22% |
| Del Taco Restaurants Inc | TACO | 2018-10-01 | 11.82 | 2018-11-05 | 11.51 | -2.62% |
| John B. Sanfilippo & Son, Inc. | JBSS | 2018-10-01 | 70.88 | 2018-11-05 | 63.68 | -10.16% |
| Kimball International Inc | KBAL | 2018-09-04 | 17.37 | 2018-11-05 | 16.51 | -4.95% |
| Unitil Corporation | UTL | 2018-09-04 | 50.66 | 2018-11-05 | 47.66 | -5.92% |
| American Railcar Industries, I | ARII | 2018-06-04 | 41.07 | 2018-11-05 | 70.45 | 71.54% |
| MiMedx Group Inc | MDXG | 2018-03-05 | 7.76 | 2018-11-05 | 6.31 | -18.69% |
| Limoneira Company | LMNR | 2018-09-04 | 30.97 | 2018-10-01 | 25.54 | -17.53% |
| American Public Education, Inc | APEI | 2018-09-04 | 34.95 | 2018-10-01 | 32.17 | -7.95% |
| Middlesex Water Company | MSEX | 2018-08-01 | 43.28 | 2018-09-04 | 45.65 | 5.48% |
| InnerWorkings, Inc. | INWK | 2018-06-04 | 8.77 | 2018-09-04 | 7.8 | -11.06% |
| Sapiens International Corporat | SPNS | 2018-06-04 | 9.58 | 2018-09-04 | 11.9 | 24.22% |
| Ennis, Inc. | EBF | 2018-02-05 | 19.9 | 2018-09-04 | 21.55 | 8.29% |
| Unitil Corporation | UTL | 2018-05-01 | 48.49 | 2018-08-01 | 50.09 | 3.3% |
| Unisys Corporation | UIS | 2018-05-01 | 11.05 | 2018-06-04 | 12.4 | 12.22% |
| American Vanguard Corp. | AVD | 2018-04-02 | 19.75 | 2018-06-04 | 22.3 | 12.91% |
| ArcBest Corp | ARCB | 2018-04-02 | 31.35 | 2018-06-04 | 46.4 | 48.01% |
| CRA International, Inc. | CRAI | 2017-12-04 | 45.03 | 2018-06-04 | 54.73 | 21.54% |
| Arbor Realty Trust Inc | ABR | 2017-06-01 | 8.2 | 2018-06-04 | 9.41 | 14.76% |
| CNX Midstream Partners LP | CNXM | 2018-04-02 | 18.06 | 2018-05-01 | 18.9 | 4.65% |
| CalAmp Corp. | CAMP | 2018-03-05 | 24.23 | 2018-05-01 | 19.72 | -18.61% |
| Bancorp Inc | TBBK | 2018-03-05 | 10.64 | 2018-04-02 | 10.56 | -0.75% |
| Northwest Natural Gas Co | NWN | 2018-02-05 | 54.7 | 2018-04-02 | 57.3 | 4.75% |
| OMNOVA Solutions Inc. | OMN | 2018-01-02 | 10.25 | 2018-04-02 | 10.65 | 3.9% |
| Marten Transport, Ltd. | MRTN | 2017-08-01 | 16.45 | 2018-04-02 | 22.5 | 36.78% |
| Global Partners LP | GLP | 2017-06-01 | 18.8 | 2018-04-02 | 15.55 | -17.29% |
| Guaranty Bancorp | GBNK | 2018-02-05 | 27.25 | 2018-03-05 | 28.45 | 4.4% |
| Vishay Precision Group Inc | VPG | 2017-12-04 | 26.2 | 2018-03-05 | 30.45 | 16.22% |
| Exactech, Inc. | EXAC | 2017-09-05 | 29.75 | 2018-03-05 | 49.25 | 65.55% |
| SJW Corp. | SJW | 2018-01-02 | 63.47 | 2018-02-05 | 56.05 | -11.69% |
| EZCORP Inc | EZPW | 2017-12-04 | 12.15 | 2018-02-05 | 12.9 | 6.17% |
| MCBC Holdings Inc | MCFT | 2017-12-04 | 22.86 | 2018-02-05 | 22.44 | -1.84% |
| Limoneira Company | LMNR | 2017-09-05 | 21.9 | 2018-02-05 | 20.02 | -8.58% |
| Spark Energy Inc | SPKE | 2017-12-04 | 13.55 | 2018-01-02 | 11.95 | -11.81% |
| KMG Chemicals, Inc. | KMG | 2017-12-04 | 53.6 | 2018-01-02 | 65.76 | 22.69% |
| SJW Corp. | SJW | 2017-11-01 | 60.01 | 2017-12-04 | 66.87 | 11.43% |
| Bassett Furniture Industries I | BSET | 2017-11-01 | 38.25 | 2017-12-04 | 38.45 | 0.52% |
| Green Plains Partners LP | GPP | 2017-10-04 | 20.2 | 2017-12-04 | 19.0 | -5.94% |
| Solar Capital Ltd. | SLRC | 2017-05-01 | 22.54 | 2017-12-04 | 21.25 | -5.72% |
| Rudolph Technologies Inc | RTEC | 2017-05-01 | 25.4 | 2017-12-04 | 23.45 | -7.68% |
| K12 Inc. | LRN | 2017-03-03 | 18.39 | 2017-12-04 | 16.55 | -10.01% |
| Unifi, Inc. | UFI | 2017-10-04 | 35.65 | 2017-11-01 | 37.13 | 4.15% |
| Unitil Corporation | UTL | 2017-09-05 | 49.51 | 2017-11-01 | 51.66 | 4.34% |
| Myers Industries, Inc. | MYE | 2017-07-03 | 18.95 | 2017-10-04 | 22.0 | 16.09% |
| Blue Bird Corp | BLBD | 2017-06-01 | 18.1 | 2017-10-04 | 20.85 | 15.19% |
| OraSure Technologies, Inc. | OSUR | 2017-08-01 | 17.75 | 2017-09-05 | 20.74 | 16.85% |
| Spark Energy Inc | SPKE | 2017-08-01 | 19.85 | 2017-09-05 | 15.7 | -20.91% |
| Ennis, Inc. | EBF | 2017-06-01 | 16.4 | 2017-09-05 | 18.9 | 15.24% |
| Quidel Corporation | QDEL | 2017-07-03 | 27.11 | 2017-08-01 | 31.93 | 17.78% |
| Unitil Corporation | UTL | 2017-05-01 | 47.75 | 2017-08-01 | 50.73 | 6.24% |
| Capital Product Partners L.P. | CPLP | 2017-03-03 | 3.24 | 2017-08-01 | 3.65 | 12.65% |
| KMG Chemicals, Inc. | KMG | 2017-06-01 | 57.61 | 2017-07-03 | 47.76 | -17.1% |
| Cardiovascular Systems Inc | CSII | 2017-04-03 | 29.07 | 2017-07-03 | 32.17 | 10.66% |
| Natural Resource Partners LP | NRP | 2017-05-01 | 32.16 | 2017-06-01 | 29.0 | -9.83% |
| Global Brass and Copper Holdin | BRSS | 2017-05-01 | 34.21 | 2017-06-01 | 30.5 | -10.84% |
| Alamo Group, Inc. | ALG | 2017-04-03 | 74.29 | 2017-06-01 | 86.3 | 16.17% |
| Supreme Industries, Inc. | STS | 2017-04-03 | 19.76 | 2017-06-01 | 17.46 | -11.64% |
| Sodastream International Ltd | SODA | 2017-01-03 | 38.99 | 2017-06-01 | 52.36 | 34.29% |
| Park Sterling Corp | PSTB | 2017-04-03 | 12.3 | 2017-05-01 | 12.29 | -0.08% |
| Aegean Marine Petroleum Networ | ANW | 2017-04-03 | 12.15 | 2017-05-01 | 11.3 | -7% |
| KMG Chemicals, Inc. | KMG | 2017-03-03 | 38.84 | 2017-05-01 | 55.3 | 42.38% |
| AudioCodes Ltd. | AUDC | 2017-02-01 | 6.31 | 2017-05-01 | 6.52 | 3.33% |
| Atlantic Power Corp | AT | 2016-05-02 | 2.74 | 2017-05-01 | 2.45 | -10.58% |
| First Defiance Financial | FDEF | 2017-03-03 | 49.85 | 2017-04-03 | 50.36 | 1.02% |
| Ducommun Incorporated | DCO | 2017-03-03 | 30.77 | 2017-04-03 | 28.12 | -8.61% |
| Blueknight Energy Partners L.P | BKEP | 2017-02-01 | 7.18 | 2017-04-03 | 6.75 | -5.99% |
| Addus Homecare Corporation | ADUS | 2016-12-01 | 33.8 | 2017-04-03 | 31.6 | -6.51% |
| Horizon Global Corp | HZN | 2016-12-01 | 23.17 | 2017-04-03 | 13.51 | -41.69% |
| Solar Senior Capital Ltd | SUNS | 2017-02-01 | 16.77 | 2017-03-03 | 17.41 | 3.82% |
| American Railcar Industries, I | ARII | 2017-01-03 | 45.8 | 2017-03-03 | 42.0 | -8.3% |
| Hackett Group, Inc., The | HCKT | 2016-12-01 | 17.09 | 2017-03-03 | 19.48 | 13.98% |
| Hudson Technologies, Inc. | HDSN | 2016-12-01 | 7.76 | 2017-03-03 | 7.13 | -8.12% |
| Endeavour Silver Corp | EXK | 2016-09-01 | 4.55 | 2017-03-03 | 3.31 | -27.25% |
| BP Prudhoe Bay Royalty Trust | BPT | 2017-01-03 | 24.07 | 2017-02-01 | 31.25 | 29.83% |
| Financial Institutions, Inc. | FISI | 2016-12-01 | 30.55 | 2017-02-01 | 33.1 | 8.35% |
| Digi International Inc. | DGII | 2016-09-01 | 11.47 | 2017-02-01 | 13.0 | 13.34% |
| Landauer, Inc. | LDR | 2016-09-01 | 46.37 | 2017-01-03 | 50.35 | 8.58% |
| Star Gas Partners LP | SGU | 2016-06-01 | 8.37 | 2017-01-03 | 10.67 | 27.48% |
| Ennis, Inc. | EBF | 2016-04-04 | 17.95 | 2017-01-03 | 17.85 | -0.56% |
| Potbelly Corp | PBPB | 2016-11-01 | 12.9 | 2016-12-01 | 13.7 | 6.2% |
| Ares Commercial Real Estate Co | ACRE | 2016-11-01 | 12.82 | 2016-12-01 | 13.54 | 5.62% |
| RadNet Inc. | RDNT | 2016-09-01 | 6.73 | 2016-12-01 | 6.05 | -10.1% |
| CECO Environmental Corp. | CECE | 2016-09-01 | 11.06 | 2016-12-01 | 13.78 | 24.59% |
| Spartan Motors, Inc. | SPAR | 2016-08-01 | 8.58 | 2016-12-01 | 8.6 | 0.23% |
| Blue Nile Inc | NILE | 2016-09-01 | 34.93 | 2016-11-01 | 34.2 | -2.09% |
| First Community Bancshares Inc | FCBC | 2016-06-01 | 21.93 | 2016-11-01 | 22.35 | 1.92% |
| KNOT Offshore Partners LP | KNOP | 2016-08-01 | 18.6 | 2016-09-01 | 19.05 | 2.42% |
| MeetMe Inc | MEET | 2016-07-05 | 5.64 | 2016-09-01 | 5.87 | 4.08% |
| PDL BioPharma Inc | PDLI | 2016-07-05 | 3.09 | 2016-09-01 | 2.97 | -3.88% |
| Monmouth R.E. Inv. Corp. | MNR | 2016-06-01 | 11.96 | 2016-09-01 | 14.08 | 17.73% |
| IES Holdings Inc | IESC | 2016-06-01 | 14.35 | 2016-09-01 | 17.21 | 19.93% |
| Ciner Resources LP | CINR | 2016-04-04 | 25.68 | 2016-09-01 | 29.14 | 13.47% |
| Superior Industries International | SUP | 2016-06-01 | 26.92 | 2016-08-01 | 30.21 | 12.22% |
| Marten Transport, Ltd. | MRTN | 2016-06-01 | 19.84 | 2016-08-01 | 21.48 | 8.27% |
| Sapiens International Corporat | SPNS | 2016-04-04 | 12.37 | 2016-07-05 | 11.84 | -4.28% |
| Enzo Biochem, Inc. | ENZ | 2016-04-04 | 4.61 | 2016-07-05 | 6.01 | 30.37% |
| First Busey Corporation | BUSE | 2016-04-04 | 19.94 | 2016-06-01 | 22.38 | 12.24% |
| Patrick Industries, Inc. | PATK | 2016-04-04 | 45.37 | 2016-06-01 | 53.85 | 18.69% |
| Sportsman's Warehouse Holdings | SPWH | 2016-04-04 | 11.62 | 2016-06-01 | 8.39 | -27.8% |
| SunCoke Energy Partners LP | SXCP | 2016-04-04 | 6.75 | 2016-06-01 | 10.97 | 62.52% |
| Universal Truckload Services, | UACL | 2016-03-01 | 15.83 | 2016-06-01 | 14.26 | -9.92% |
| Big 5 Sporting Goods Corporati | BGFV | 2016-03-01 | 12.96 | 2016-06-01 | 8.35 | -35.57% |
| Spark Energy Inc | SPKE | 2015-12-01 | 17.84 | 2016-05-02 | 24.94 | 39.8% |
| Chase Corporation | CCF | 2016-03-01 | 47.15 | 2016-04-04 | 52.18 | 10.67% |
| Miller Industries, Inc. | MLR | 2016-02-01 | 21.03 | 2016-04-04 | 20.27 | -3.61% |
| TransMontaigne Partners L.P. | TLP | 2016-02-01 | 30.41 | 2016-04-04 | 36.16 | 18.91% |
| LeMaitre Vascular Inc | LMAT | 2016-02-01 | 14.52 | 2016-04-04 | 15.87 | 9.3% |
| Omega Protein Corporation | OME | 2016-01-04 | 20.6 | 2016-04-04 | 16.2 | -21.36% |
| Arbor Realty Trust Inc | ABR | 2016-01-04 | 7.08 | 2016-04-04 | 6.71 | -5.23% |
| Old Second Bancorp Inc. | OSBC | 2015-12-01 | 7.77 | 2016-04-04 | 7.19 | -7.46% |
| Zix Corporation | ZIXI | 2014-12-01 | 3.09 | 2016-04-04 | 3.86 | 24.92% |
| Carriage Services, Inc. | CSV | 2016-02-01 | 22.45 | 2016-03-01 | 20.71 | -7.75% |
| AEP Industries | AEPI | 2016-01-04 | 72.97 | 2016-03-01 | 78.5 | 7.58% |
| Air Transport Services Group I | ATSG | 2016-01-04 | 9.87 | 2016-03-01 | 11.7 | 18.54% |
| Fonar Corporation | FONR | 2015-12-01 | 16.37 | 2016-02-01 | 14.17 | -13.44% |
| Blueknight Energy Partners L.P | BKEP | 2015-12-01 | 5.97 | 2016-02-01 | 4.9 | -17.92% |
| Delta Apparel, Inc. | DLA | 2015-12-01 | 15.01 | 2016-02-01 | 12.0 | -20.05% |
| Consolidated Water Co. Ltd. | CWCO | 2015-09-01 | 10.15 | 2016-02-01 | 11.23 | 10.64% |
| Sun Hydraulics Corporation | SNHY | 2015-12-01 | 31.8 | 2016-01-04 | 30.57 | -3.87% |
| Global Ship Lease, Inc. | GSL | 2015-12-01 | 3.4 | 2016-01-04 | 2.6 | -23.53% |
| Kirin International Holding In | KIRI | 2015-12-01 | 5.64 | 2016-01-04 | 5.5 | -2.48% |
| Limoneira Company | LMNR | 2015-11-02 | 16.06 | 2016-01-04 | 14.31 | -10.9% |
| Calamos Asset Management, Inc | CLMS | 2015-11-02 | 9.45 | 2015-12-01 | 9.63 | 1.9% |
| CPI Aerostructures, Inc. | CVU | 2015-11-02 | 8.68 | 2015-12-01 | 9.69 | 11.64% |
| RGC Resources Inc | RGCO | 2015-11-02 | 21.52 | 2015-12-01 | 21.29 | -1.07% |
| Cumberland Pharmaceuticals, In | CPIX | 2015-11-02 | 6.31 | 2015-12-01 | 5.61 | -11.09% |
| Evolution Petroleum Corporatio | EPM | 2015-09-01 | 5.62 | 2015-12-01 | 6.46 | 14.95% |
| Diana Containerships Inc | DCIX | 2015-09-01 | 1.64 | 2015-12-01 | 0.97 | -40.85% |
| Endeavour Silver Corp | EXK | 2015-06-01 | 2.0 | 2015-12-01 | 1.48 | -26% |
| Commercial Vehicle Group, Inc. | CVGI | 2015-06-01 | 6.29 | 2015-12-01 | 3.36 | -46.58% |
| Old Second Bancorp Inc. | OSBC | 2015-09-01 | 6.05 | 2015-11-02 | 6.89 | 13.88% |
| Craft Brew Alliance Inc | BREW | 2015-09-01 | 7.64 | 2015-11-02 | 7.4 | -3.14% |
| LMI Aerospace, Inc. | LMIA | 2015-09-01 | 11.83 | 2015-11-02 | 10.75 | -9.13% |
| Delta Natural Gas Co Inc | DGAS | 2015-09-01 | 20.4 | 2015-11-02 | 20.62 | 1.08% |
| Alliance Imaging, Inc. | AIQ | 2015-06-01 | 18.64 | 2015-11-02 | 9.2 | -50.64% |
| Marten Transport, Ltd. | MRTN | 2015-07-01 | 21.83 | 2015-09-01 | 18.17 | -16.77% |
| Artesian Resources Corporation | ARTNA | 2015-07-01 | 21.11 | 2015-09-01 | 21.74 | 2.98% |
| Adams Resources & Energy, Inc. | AE | 2015-06-01 | 43.1 | 2015-09-01 | 43.56 | 1.07% |
| Higher One Holdings, Inc | ONE | 2015-06-01 | 2.81 | 2015-09-01 | 1.88 | -33.1% |
| Twin Disc, Incorporated | TWIN | 2015-06-01 | 18.16 | 2015-09-01 | 13.52 | -25.55% |
| Pennantpark Floating Rate Capi | PFLT | 2015-05-04 | 13.91 | 2015-09-01 | 12.18 | -12.44% |
| Alliance One International, In | AOI | 2015-05-04 | 13.5 | 2015-09-01 | 23.43 | 73.56% |
| York Water Company, The | YORW | 2015-02-02 | 23.28 | 2015-07-01 | 21.12 | -9.28% |
| Rand Logistics, Inc. | RLOG | 2014-12-01 | 4.45 | 2015-07-01 | 3.18 | -28.54% |
| China Automotive Systems, Inc. | CAAS | 2015-05-04 | 7.23 | 2015-06-01 | 7.81 | 8.02% |
| Evolution Petroleum Corporatio | EPM | 2015-05-04 | 6.58 | 2015-06-01 | 7.0 | 6.38% |
| Gordmans Stores, Inc. | GMAN | 2015-04-01 | 7.8 | 2015-06-01 | 5.72 | -26.67% |
| Silvercorp Metals Inc. (USA) | SVM | 2015-04-01 | 1.24 | 2015-06-01 | 1.15 | -7.26% |
| LeMaitre Vascular Inc | LMAT | 2015-03-02 | 7.51 | 2015-06-01 | 9.98 | 32.89% |
| CPI Aerostructures, Inc. | CVU | 2015-03-02 | 12.16 | 2015-06-01 | 10.89 | -10.44% |
| JAKKS Pacific, Inc. | JAKK | 2015-04-01 | 6.85 | 2015-05-04 | 6.94 | 1.31% |
| Earthstone Energy Inc | ESTE | 2015-03-02 | 28.57 | 2015-05-04 | 24.92 | -12.78% |
| MutualFirst Financial, Inc. | MFSF | 2015-02-02 | 22.23 | 2015-05-04 | 22.39 | 0.72% |
| G. Willi-Food International Li | WILC | 2014-10-01 | 6.97 | 2015-05-04 | 5.64 | -19.08% |
| Commercial Vehicle Group, Inc. | CVGI | 2015-01-05 | 6.69 | 2015-04-01 | 6.49 | -2.99% |
| Information Services Group, In | III | 2014-12-01 | 3.83 | 2015-04-01 | 3.94 | 2.87% |
| ALJ Regional Holdings, Inc. | ALJJ | 2014-08-04 | 3.03 | 2015-04-01 | 4.3 | 41.91% |
| Blueknight Energy Partners L.P | BKEP | 2015-01-05 | 6.48 | 2015-03-02 | 7.49 | 15.59% |
| Synalloy Corporation | SYNL | 2014-09-02 | 17.61 | 2015-03-02 | 14.37 | -18.4% |
| LifeVantage Corp | LFVN | 2014-06-02 | 1.29 | 2015-03-02 | 0.94 | -27.13% |
| Artesian Resources Corporation | ARTNA | 2015-01-05 | 22.49 | 2015-02-02 | 22.3 | -0.84% |
| Republic First Bancorp, Inc. | FRBK | 2014-12-01 | 3.79 | 2015-02-02 | 3.54 | -6.6% |
| Entergy New Orleans, Inc. | EYNON | 2014-12-01 | 98.59 | 2015-01-05 | 102.0 | 3.46% |
| Earthstone Energy Inc | ESTE | 2014-11-03 | 23.75 | 2015-01-05 | 22.2 | -6.53% |
| Hooker Furniture Corporation | HOFT | 2014-07-02 | 16.36 | 2015-01-05 | 17.71 | 8.25% |
| CTPartners Executive Search Inc. | CTP | 2014-09-02 | 18.05 | 2014-12-01 | 18.6 | 3.05% |
| Consolidated Water Co. Ltd. | CWCO | 2014-09-02 | 12.37 | 2014-12-01 | 12.42 | 0.4% |
| Simulations Plus, Inc. | SLP | 2014-09-02 | 6.62 | 2014-12-01 | 6.31 | -4.68% |
| Global Ship Lease, Inc. | GSL | 2014-07-02 | 4.03 | 2014-12-01 | 3.87 | -3.97% |
| LNB Bancorp Inc | LNBB | 2013-12-03 | 10.16 | 2014-12-01 | 16.25 | 59.94% |
| North American Energy Partners | NOA | 2014-10-01 | 6.23 | 2014-11-03 | 5.11 | -17.98% |
| Summer Infant, Inc. | SUMR | 2014-08-04 | 4.06 | 2014-10-01 | 3.55 | -12.56% |
| Mitcham Industries, Inc. | MIND | 2014-07-02 | 13.95 | 2014-10-01 | 10.45 | -25.09% |
| ENGlobal Corp | ENG | 2014-08-04 | 2.96 | 2014-09-02 | 2.73 | -7.77% |
| Zix Corporation | ZIXI | 2014-08-04 | 3.53 | 2014-09-02 | 3.84 | 8.78% |
| Artesian Resources Corporation | ARTNA | 2014-07-02 | 22.39 | 2014-09-02 | 21.17 | -5.45% |
| U.S. Auto Parts Network, Inc. | PRTS | 2014-07-02 | 3.63 | 2014-09-02 | 3.03 | -16.53% |
| Aemetis Inc | AMTX | 2014-07-02 | 10.19 | 2014-08-04 | 10.9 | 6.97% |
| Hudson Technologies, Inc. | HDSN | 2014-07-02 | 3.07 | 2014-08-04 | 2.7 | -12.05% |
| Merge Healthcare Inc. | MRGE | 2014-07-02 | 2.36 | 2014-08-04 | 2.39 | 1.27% |
| Coffee Holding Co Inc | JVA | 2014-02-03 | 5.06 | 2014-08-04 | 6.19 | 22.33% |
| China Green Agriculture, Inc | CGA | 2014-06-02 | 2.34 | 2014-07-02 | 2.18 | -6.84% |
| Equal Energy Ltd. (USA) | EQU | 2014-05-01 | 4.39 | 2014-07-02 | 5.41 | 23.23% |
| Evolving Systems Inc | EVOL | 2014-05-01 | 8.37 | 2014-07-02 | 9.56 | 14.22% |
| General Steel Holdings Inc | GSI | 2014-04-01 | 1.26 | 2014-07-02 | 0.99 | -21.43% |
| Consolidated Water Co. Ltd. | CWCO | 2014-04-01 | 12.87 | 2014-07-02 | 11.89 | -7.61% |
| CTPartners Executive Search Inc. | CTP | 2014-04-01 | 10.86 | 2014-07-02 | 9.85 | -9.3% |
| Crown Crafts, Inc. | CRWS | 2014-03-03 | 8.94 | 2014-07-02 | 7.95 | -11.07% |
| Radiant Logistics, Inc. | RLGT | 2014-03-03 | 2.99 | 2014-07-02 | 3.0 | 0.33% |
| CompX International Inc. | CIX | 2014-05-01 | 9.33 | 2014-06-02 | 10.7 | 14.68% |
| LeMaitre Vascular Inc | LMAT | 2014-04-01 | 8.2 | 2014-06-02 | 7.3 | -10.98% |
| Penford Corporation | PENX | 2014-03-03 | 13.02 | 2014-05-01 | 12.22 | -6.14% |
| Fieldpoint Petroleum Corporation | FPP | 2014-02-03 | 4.36 | 2014-05-01 | 5.35 | 22.71% |
| Information Services Group, In | III | 2013-11-04 | 4.28 | 2014-05-01 | 4.99 | 16.59% |
| Artesian Resources Corporation | ARTNA | 2014-02-03 | 21.97 | 2014-04-01 | 22.31 | 1.55% |
| NeoGenomics, Inc. | NEO | 2013-12-03 | 3.69 | 2014-04-01 | 3.63 | -1.63% |
| Fuel Tech Inc. | FTEK | 2013-10-01 | 4.22 | 2014-04-01 | 5.28 | 25.12% |
| RRSat Global Communications Ne | RRST | 2013-07-02 | 7.84 | 2014-04-01 | 9.0 | 14.8% |
| Strattec Security Corp. | STRT | 2014-02-03 | 54.46 | 2014-03-03 | 71.12 | 30.59% |
| USA Truck, Inc. | USAK | 2013-10-01 | 8.98 | 2014-03-03 | 15.3 | 70.38% |
| UFP Technologies Inc | UFPT | 2013-09-03 | 20.62 | 2014-03-03 | 25.23 | 22.36% |
| Ballantyne Strong Inc | BTN | 2014-01-02 | 4.68 | 2014-02-03 | 4.61 | -1.5% |
| Bolt Technology Corp. | BOLT | 2014-01-02 | 20.58 | 2014-02-03 | 21.19 | 2.96% |
| G. Willi-Food International Li | WILC | 2013-12-03 | 8.2 | 2014-02-03 | 7.86 | -4.15% |
| Gas Natural Inc | EGAS | 2013-11-04 | 9.75 | 2014-02-03 | 9.17 | -5.95% |
| American Eagle Energy Corp | AMZG | 2013-11-04 | 2.25 | 2014-01-02 | 2.06 | -8.44% |
| Crown Crafts, Inc. | CRWS | 2012-10-11 | 5.42 | 2014-01-02 | 7.91 | 45.94% |
| Skilled Healthcare Group, Inc. | SKH | 2013-11-04 | 4.57 | 2013-12-03 | 5.01 | 9.63% |
| Firstbank Corporation | FBMI | 2013-08-05 | 16.22 | 2013-12-03 | 19.51 | 20.28% |
| Summer Infant, Inc. | SUMR | 2013-06-04 | 3.38 | 2013-12-03 | 2.1 | -37.87% |
| Corning Natural Gas Corp | CNIG | 2013-10-01 | 17.1 | 2013-11-04 | 17.9 | 4.68% |
| NeoGenomics, Inc. | NEO | 2013-09-03 | 2.32 | 2013-11-04 | 3.79 | 63.36% |
| Evolving Systems Inc | EVOL | 2013-07-02 | 6.64 | 2013-11-04 | 10.2 | 53.61% |
| SinoCoking Coal and Coke Chem | SCOK | 2013-06-04 | 1.49 | 2013-11-04 | 1.22 | -18.12% |
| Globus Maritime Ltd | GLBS | 2013-09-03 | 2.57 | 2013-10-01 | 3.11 | 21.01% |
| RGC Resources Inc | RGCO | 2013-09-03 | 18.71 | 2013-10-01 | 19.26 | 2.94% |
| Comstock Holding Companies Inc | CHCI | 2013-08-05 | 2.58 | 2013-10-01 | 1.81 | -29.84% |
| Air T Inc | AIRT | 2013-07-02 | 10.07 | 2013-09-03 | 10.53 | 4.57% |
| Delta Natural Gas Co Inc | DGAS | 2013-07-02 | 21.17 | 2013-09-03 | 20.06 | -5.24% |
| Medical Action Industries | MDCI | 2013-07-02 | 8.45 | 2013-09-03 | 5.29 | -37.4% |
| General Finance Corporation | GFN | 2013-07-02 | 4.76 | 2013-09-03 | 4.97 | 4.41% |
| Arts-Way Manufacturing Co. Inc | ARTW | 2013-06-04 | 7.56 | 2013-08-05 | 7.0 | -7.41% |
| Republic First Bancorp, Inc. | FRBK | 2013-05-06 | 2.9 | 2013-08-05 | 3.63 | 25.17% |
| Radiant Logistics, Inc. | RLGT | 2013-05-06 | 1.96 | 2013-07-02 | 1.95 | -0.51% |
| Addus Homecare Corporation | ADUS | 2013-05-06 | 13.76 | 2013-07-02 | 19.12 | 38.95% |
| GSE Systems, Inc. | GVP | 2013-02-01 | 2.17 | 2013-07-02 | 1.52 | -29.95% |
| Claude Resources Inc. (USA) | CGR | 2013-01-09 | 0.53 | 2013-07-02 | 0.23 | -56.6% |
| Famous Dave's of America, Inc. | DAVE | 2012-03-01 | 10.9 | 2013-07-02 | 15.45 | 41.74% |
| Consolidated Water Co. Ltd. | CWCO | 2011-10-03 | 7.15 | 2013-07-02 | 11.21 | 56.78% |
| CAMAC Energy Inc | CAK | 2013-05-06 | 0.6 | 2013-06-04 | 0.55 | -8.33% |
| Craft Brew Alliance Inc | BREW | 2013-05-06 | 7.87 | 2013-06-04 | 7.53 | -4.32% |
| Aerosonic Corporation | AIM | 2013-05-06 | 7.73 | 2013-06-04 | 7.73 | 0% |
| China Cord Blood Corp | CO | 2013-04-01 | 2.86 | 2013-05-06 | 2.9 | 1.4% |
| Home Federal Bancorp, Inc. | HOME | 2013-03-05 | 11.71 | 2013-05-06 | 12.11 | 3.42% |
| Pacer International, Inc. | PACR | 2013-02-01 | 4.04 | 2013-05-06 | 5.96 | 47.52% |
| Omega Protein Corporation | OME | 2013-01-09 | 6.45 | 2013-05-06 | 8.78 | 36.12% |
| CECO Environmental Corp. | CECE | 2012-12-07 | 9.26 | 2013-05-06 | 12.05 | 30.13% |
| PowerSecure International, Inc | POWR | 2012-10-11 | 6.22 | 2013-05-06 | 13.73 | 120.74% |
| Addus Homecare Corporation | ADUS | 2013-02-01 | 8.06 | 2013-04-01 | 13.49 | 67.37% |
| Manning and Napier Inc | MN | 2013-02-01 | 14.67 | 2013-03-05 | 15.09 | 2.86% |
| Global Ship Lease, Inc. | GSL | 2013-01-09 | 3.32 | 2013-02-01 | 3.91 | 17.77% |
| Access National Corporation | ANCX | 2012-12-07 | 13.43 | 2013-02-01 | 15.47 | 15.19% |
| BioClinica Inc | BIOC | 2012-12-07 | 5.87 | 2013-02-01 | 7.26 | 23.68% |
| Zix Corporation | ZIXI | 2012-09-04 | 2.55 | 2013-02-01 | 3.36 | 31.76% |
| Jamba, Inc. | JMBA | 2012-12-07 | 2.08 | 2013-01-09 | 2.5 | 20.19% |
| Orchids Paper Products Company | TIS | 2012-12-07 | 21.0 | 2013-01-09 | 21.51 | 2.43% |
| Covenant Transportation Group, | CVTI | 2012-09-04 | 4.86 | 2013-01-09 | 5.69 | 17.08% |
| DUSA Pharmaceuticals, Inc. | DUSA | 2012-10-11 | 6.92 | 2012-12-07 | 7.97 | 15.17% |
| Energy Recovery, Inc. | ERII | 2012-10-11 | 3.02 | 2012-12-07 | 3.24 | 7.28% |
| Northern Technologies Internat | NTIC | 2012-08-13 | 9.83 | 2012-12-07 | 9.88 | 0.51% |
| North Valley Bancorp | NOVB | 2012-07-06 | 13.21 | 2012-12-07 | 14.13 | 6.96% |
| American Dairy, Inc | ADY | 2011-09-01 | 5.96 | 2012-12-07 | 6.69 | 12.25% |
| Met-Pro Corporation | MPR | 2012-05-03 | 9.89 | 2012-10-11 | 9.08 | -8.19% |
| Cryolife Inc | CRY | 2012-03-01 | 5.46 | 2012-10-11 | 6.18 | 13.19% |
| Hooker Furniture Corporation | HOFT | 2011-12-05 | 9.17 | 2012-10-11 | 13.04 | 42.2% |
| L&L Energy, Inc. | LLEN | 2011-12-05 | 3.14 | 2012-10-11 | 1.84 | -41.4% |
| Paragon Shipping Inc. | PRGN | 2012-07-06 | 0.55 | 2012-09-04 | 0.42 | -23.64% |
| Pervasive Software Inc. | PVSW | 2012-07-06 | 7.27 | 2012-09-04 | 8.34 | 14.72% |
| Material Sciences Corporation | MASC | 2012-04-02 | 8.24 | 2012-08-13 | 8.39 | 1.82% |
| CalAmp Corp. | CAMP | 2012-06-01 | 6.1 | 2012-07-06 | 7.57 | 24.1% |
| Patriot Transportation Holding | PATR | 2012-05-03 | 20.32 | 2012-07-06 | 23.33 | 14.81% |
| Signature Group Holdings, Inc. | SGGH | 2011-12-05 | 0.29 | 2012-07-06 | 0.37 | 27.59% |
| EasyLink Services Internationa | ESIC | 2011-05-02 | 4.17 | 2012-06-01 | 7.17 | 71.94% |
| Radiant Logistics, Inc. | RLGT | 2012-04-02 | 2.19 | 2012-05-03 | 2.0 | -8.68% |
| TGC Industries, Inc. | TGE | 2011-09-01 | 5.97 | 2012-05-03 | 10.45 | 75.04% |
| StealthGas Inc. | GASS | 2011-12-05 | 3.88 | 2012-04-02 | 5.96 | 53.61% |
| Handy and Harman Ltd | HNH | 2011-12-05 | 11.76 | 2012-04-02 | 15.08 | 28.23% |
| AMCON Distributing Co. | DIT | 2012-01-03 | 66.22 | 2012-03-01 | 62.18 | -6.1% |
| Almost Family, Inc. | AFAM | 2012-01-03 | 16.64 | 2012-03-01 | 23.22 | 39.54% |
| IMPAC Mortgage Holdings, Inc | IMH | 2011-12-05 | 1.99 | 2012-01-03 | 2.07 | 4.02% |
| Skilled Healthcare Group, Inc. | SKH | 2011-11-01 | 3.67 | 2012-01-03 | 5.45 | 48.5% |
| China Valves Technology, Inc. | CVVT | 2011-10-03 | 2.12 | 2011-12-05 | 2.67 | 25.94% |
| Johnson Outdoors Inc. | JOUT | 2011-09-01 | 15.7 | 2011-12-05 | 16.2 | 3.18% |
| Universal Insurance Holdings, | UVE | 2011-09-01 | 4.05 | 2011-12-05 | 3.56 | -12.1% |
| Constellation Energy Partners | CEP | 2011-09-01 | 3.03 | 2011-12-05 | 2.23 | -26.4% |
| Conrad Industries Inc | CNRD | 2011-06-06 | 13.15 | 2011-12-05 | 14.51 | 10.34% |
| Dex One Corporation | DEXO | 2011-06-06 | 2.1 | 2011-12-05 | 1.6 | -23.81% |
| Acura Pharmaceuticals, Inc. | ACUR | 2011-09-01 | 2.95 | 2011-11-01 | 4.15 | 40.68% |
| NN, Inc. | NNBR | 2011-09-01 | 7.38 | 2011-10-03 | 4.71 | -36.18% |
| Delta Natural Gas Co Inc | DGAS | 2011-06-06 | 30.98 | 2011-10-03 | 31.39 | 1.32% |
| Gulf Resources, Inc. | GURE | 2011-08-02 | 3.42 | 2011-09-01 | 1.86 | -45.61% |
| Michael Baker Corporation | BKR | 2011-07-05 | 21.21 | 2011-09-01 | 22.22 | 4.76% |
| Standard Register Company, The | SR | 2011-07-05 | 3.08 | 2011-09-01 | 2.72 | -11.69% |
| Pulaski Financial Corp. | PULB | 2011-07-05 | 7.27 | 2011-09-01 | 6.43 | -11.55% |
| Exceed Co Ltd | EDS | 2011-06-06 | 5.73 | 2011-09-01 | 4.09 | -28.62% |
| CE Franklin Ltd. (USA) | CFK | 2011-05-02 | 9.85 | 2011-09-01 | 8.2 | -16.75% |
| RTI Biologics Inc. | RTIX | 2011-05-02 | 2.76 | 2011-09-01 | 3.32 | 20.29% |
| Pope Resources L.P. | POPE | 2011-05-02 | 44.61 | 2011-08-02 | 46.11 | 3.36% |
| HQ Sustainable Maritime Indust | HQS | 2011-06-06 | 2.78 | 2011-07-05 | 2.78 | 0% |
| Elbit Imaging Ltd | EMITF | 2011-06-06 | 7.12 | 2011-07-05 | 6.71 | -5.76% |
| Signature Group Holdings, Inc. | SGGH | 2011-05-02 | 0.71 | 2011-07-05 | 0.7 | -1.41% |
| Hardinge Inc. | HDNG | 2011-05-02 | 12.56 | 2011-06-06 | 10.14 | -19.27% |
| R.G. Barry Corp. | DFZ | 2011-05-02 | 11.88 | 2011-06-06 | 10.74 | -9.6% |
| Lifetime Brands, Inc. | LCUT | 2011-05-02 | 15.47 | 2011-06-06 | 11.11 | -28.18% |
| Trans World Entertainment Corp | TWMC | 2011-05-02 | 1.64 | 2011-06-06 | 1.95 | 18.9% |
| Pennichuck Corporation | PNNW | 2011-05-02 | 28.19 | 2011-06-06 | 28.35 | 0.57% |
| Horizon Lines, Inc. | HRZ | 2011-01-03 | 4.46 | 2011-06-06 | 1.14 | -74.44% |
| Force Protection, Inc. | FRPT | 2011-04-01 | 4.93 | 2011-05-02 | 4.5 | -8.72% |
| Peet's Coffee & Tea, Inc. | PEET | 2011-04-01 | 47.93 | 2011-05-02 | 46.42 | -3.15% |
| Flagstone Reinsurance Holdings | FSR | 2011-04-01 | 9.11 | 2011-05-02 | 8.29 | -9% |
| Crosstex Energy, Inc. | XTXI | 2011-04-01 | 9.94 | 2011-05-02 | 10.65 | 7.14% |
| Skilled Healthcare Group, Inc. | SKH | 2011-04-01 | 14.15 | 2011-05-02 | 12.34 | -12.79% |
| Libbey Inc. | LBY | 2011-03-01 | 16.82 | 2011-05-02 | 16.52 | -1.78% |
| School Specialty, Inc. | SCHS | 2011-01-03 | 14.14 | 2011-05-02 | 14.48 | 2.4% |
| PetroQuest Energy, Inc. | PQ | 2010-12-01 | 7.21 | 2011-05-02 | 9.02 | 25.1% |
| M & F Worldwide Corp. | MFW | 2010-12-01 | 23.84 | 2011-05-02 | 24.46 | 2.6% |
| Fushi Copperweld, Inc. | FSIN | 2010-12-01 | 8.93 | 2011-05-02 | 8.34 | -6.61% |
| Consolidated Water Co. Ltd. | CWCO | 2011-03-01 | 10.49 | 2011-04-01 | 10.78 | 2.76% |
| Ducommun Incorporated | DCO | 2011-03-01 | 22.16 | 2011-04-01 | 24.06 | 8.57% |
| Coca-Cola Bottling Co. Consoli | COKE | 2011-01-03 | 56.69 | 2011-04-01 | 66.79 | 17.82% |
| Universal Insurance Holdings, | UVE | 2010-10-01 | 4.32 | 2011-04-01 | 5.5 | 27.31% |
| Five Star Quality Care, Inc. | FVE | 2010-09-01 | 4.45 | 2011-04-01 | 8.42 | 89.21% |
| Atlas Pipeline Holdings, L.P. | AHD | 2011-01-03 | 15.1 | 2011-03-01 | 16.83 | 11.46% |
| Select Comfort Corp. | SCSS | 2010-12-01 | 8.96 | 2011-03-01 | 10.74 | 19.87% |
| Great Lakes Dredge & Dock Corp | GLDD | 2010-09-01 | 5.19 | 2011-03-01 | 7.66 | 47.59% |
| Tsakos Energy Navigation Ltd. | TNP | 2010-12-01 | 10.04 | 2011-01-03 | 10.07 | 0.3% |
| Photronics, Inc. | PLAB | 2010-10-01 | 5.32 | 2011-01-03 | 5.97 | 12.22% |
| Ennis, Inc. | EBF | 2010-10-01 | 18.29 | 2011-01-03 | 17.43 | -4.7% |
| Crosstex Energy, Inc. | XTXI | 2010-09-01 | 7.75 | 2011-01-03 | 9.08 | 17.16% |
| Kindred Healthcare, Inc. | KND | 2010-11-02 | 14.7 | 2010-12-01 | 16.63 | 13.13% |
| Furniture Brands International | FBN | 2010-11-02 | 5.17 | 2010-12-01 | 4.57 | -11.61% |
| TPC Group, Inc. | TPCG | 2010-10-01 | 24.0 | 2010-12-01 | 27.89 | 16.21% |
| Toreador Resources Corporation | TRGL | 2010-10-01 | 12.24 | 2010-12-01 | 15.8 | 29.08% |
| Greenbrier Companies, The | GBX | 2010-10-01 | 16.03 | 2010-12-01 | 19.41 | 21.09% |
| McClatchy Company, The | MNI | 2010-10-01 | 3.86 | 2010-11-02 | 2.87 | -25.65% |
| Callaway Golf Company | ELY | 2010-08-02 | 7.1 | 2010-11-02 | 7.04 | -0.85% |
| American Dairy, Inc | ADY | 2010-09-01 | 7.96 | 2010-10-01 | 10.04 | 26.13% |
| Asta Funding, Inc. | ASFI | 2010-09-01 | 8.2 | 2010-10-01 | 7.64 | -6.83% |
| VirnetX Holding Corporation | VHC | 2010-09-01 | 7.73 | 2010-10-01 | 15.05 | 94.7% |
| Republic Airways Holdings Inc. | RJET | 2010-09-01 | 7.53 | 2010-10-01 | 8.4 | 11.55% |
| Jackson Hewitt Tax Service Inc | JTX | 2010-08-02 | 1.13 | 2010-10-01 | 1.0 | -11.5% |
| PetroQuest Energy, Inc. | PQ | 2010-07-01 | 6.65 | 2010-10-01 | 6.06 | -8.87% |
| Buckeye Technologies Inc. | BKI | 2010-06-16 | 12.51 | 2010-10-01 | 14.78 | 18.15% |
| Dynegy Inc. | DYN | 2010-08-02 | 3.69 | 2010-09-01 | 5.05 | 36.86% |
| Beazer Homes USA, Inc. | BZH | 2010-08-02 | 4.44 | 2010-09-01 | 3.79 | -14.64% |
| Calavo Growers, Inc. | CVGW | 2010-07-01 | 18.95 | 2010-09-01 | 19.14 | 1% |
| iShares S&P Global Financials | IXG | 2010-07-01 | 39.13 | 2010-09-01 | 42.62 | 8.92% |
| Sun Healthcare Group, Inc. | SUNH | 2010-06-01 | 9.06 | 2010-09-01 | 8.24 | -9.05% |
| Audiovox Corporation | VOXX | 2010-06-01 | 8.06 | 2010-09-01 | 6.77 | -16% |
| Air Transport Services Group I | ATSG | 2010-06-01 | 5.42 | 2010-09-01 | 4.89 | -9.78% |
| Sonic Automotive, Inc. | SAH | 2010-07-01 | 8.56 | 2010-08-02 | 9.93 | 16% |
| Insteel Industries, Inc. | IIIN | 2010-06-01 | 12.27 | 2010-08-02 | 9.28 | -24.37% |
| Imation Corp. | IMN | 2010-05-03 | 11.1 | 2010-08-02 | 9.51 | -14.32% |
| Unitil Corporation | UTL | 2010-04-01 | 22.47 | 2010-08-02 | 21.47 | -4.45% |
| Zale Corporation | ZLC | 2010-06-01 | 2.65 | 2010-07-01 | 1.57 | -40.75% |
| Blyth, Inc. | BTH | 2010-06-01 | 46.82 | 2010-07-01 | 34.21 | -26.93% |
| SinoCoking Coal and Coke Chem | SCOK | 2010-05-03 | 21.86 | 2010-07-01 | 11.81 | -45.97% |
| Penson Worldwide, Inc. | PNSN | 2010-05-03 | 9.43 | 2010-07-01 | 5.6 | -40.62% |
| Bway Holding Company | BWY | 2010-06-01 | 19.93 | 2010-06-16 | 20.0 | 0.35% |
| Bon-Ton Stores, Inc., The | BONT | 2010-05-03 | 17.78 | 2010-06-01 | 12.44 | -30.03% |
| Pacer International, Inc. | PACR | 2010-05-03 | 6.95 | 2010-06-01 | 7.83 | 12.66% |
| TPC Group, Inc. | TPCG | 2010-05-03 | 13.9 | 2010-06-01 | 17.85 | 28.42% |
| M/I Homes, Inc. | MHO | 2010-04-01 | 14.65 | 2010-06-01 | 11.01 | -24.85% |
| Alliance One International, In | AOI | 2010-04-01 | 5.2 | 2010-06-01 | 4.04 | -22.31% |
| Quidel Corporation | QDEL | 2010-04-01 | 14.43 | 2010-06-01 | 11.16 | -22.66% |
| CIBER, Inc. | CBR | 2009-12-01 | 3.18 | 2010-06-01 | 2.82 | -11.32% |
| Cardtronics, Inc. | CATM | 2010-03-03 | 10.02 | 2010-05-03 | 14.16 | 41.32% |
| Horizon Lines, Inc. | HRZ | 2010-03-01 | 4.17 | 2010-05-03 | 5.72 | 37.17% |
| Tuesday Morning Corporation | TUES | 2010-03-01 | 6.35 | 2010-05-03 | 6.02 | -5.2% |
| Sealy Corporation | ZZ | 2010-03-01 | 3.64 | 2010-05-03 | 3.89 | 6.87% |
| Boise Inc. | BZ | 2009-12-01 | 5.11 | 2010-05-03 | 7.12 | 39.33% |
| PetroQuest Energy, Inc. | PQ | 2009-09-01 | 4.02 | 2010-05-03 | 6.13 | 52.49% |
| Gibraltar Industries, Inc. | ROCK | 2010-03-01 | 13.01 | 2010-04-01 | 12.99 | -0.15% |
| QLT Inc. (USA) | QLTI | 2010-01-04 | 4.98 | 2010-04-01 | 5.25 | 5.42% |
| Exterran Partners, L.P. | EXLP | 2009-12-01 | 19.27 | 2010-04-01 | 22.01 | 14.22% |
| Reddy Ice Holdings, Inc | FRZ | 2009-11-02 | 3.69 | 2010-04-01 | 4.59 | 24.39% |
| iShares S&P Global Financials | IXG | 2010-03-01 | 43.91 | 2010-03-03 | 44.53 | 1.41% |
| Hawaiian Holdings, Inc. | HA | 2010-01-04 | 7.1 | 2010-03-01 | 8.09 | 13.94% |
| Beazer Homes USA, Inc. | BZH | 2010-01-04 | 5.26 | 2010-03-01 | 4.23 | -19.58% |
| Rush Enterprises, Inc. | RUSHA | 2010-01-04 | 12.42 | 2010-03-01 | 10.96 | -11.76% |
| DineEquity, Inc. | DIN | 2009-11-02 | 20.76 | 2010-03-01 | 29.32 | 41.23% |
| Doral Financial Corp. | DRL | 2009-11-02 | 2.63 | 2010-03-01 | 3.61 | 37.26% |
| Quiksilver, Inc. | ZQK | 2009-11-02 | 1.97 | 2010-01-04 | 2.24 | 13.71% |
| NCI Building Systems, Inc. | NCS | 2009-11-02 | 1.9 | 2010-01-04 | 2.04 | 7.37% |
| Pinnacle Airlines Corp. | PNCL | 2009-09-01 | 6.3 | 2010-01-04 | 7.03 | 11.59% |
| Kendle International Inc. | KNDL | 2009-09-01 | 13.42 | 2010-01-04 | 18.85 | 40.46% |
| Kimball International | KBALB | 2009-11-02 | 7.97 | 2009-12-01 | 8.15 | 2.26% |
| Buckeye Technologies Inc. | BKI | 2009-10-01 | 10.54 | 2009-12-01 | 9.75 | -7.5% |
| A-Power Energy Generation Syst | APWR | 2009-09-01 | 8.0 | 2009-12-01 | 16.16 | 102% |
| West Marine, Inc. | WMAR | 2009-10-01 | 7.55 | 2009-11-02 | 7.82 | 3.58% |
| Ennis, Inc. | EBF | 2009-10-01 | 16.02 | 2009-11-02 | 14.58 | -8.99% |
| Southwest Bancorp, Inc. | OKSB | 2009-10-01 | 13.21 | 2009-11-02 | 9.63 | -27.1% |
| Quantum Corporation | QTM | 2009-09-01 | 1.16 | 2009-11-02 | 1.79 | 54.31% |
| Lithia Motors, Inc. | LAD | 2009-09-01 | 12.45 | 2009-11-02 | 8.16 | -34.46% |
| GenCorp Inc. | GY | 2009-08-03 | 2.71 | 2009-11-02 | 7.27 | 168.27% |
| Boise Inc. | BZ | 2009-09-01 | 4.16 | 2009-10-01 | 5.12 | 23.08% |
| Doral Financial Corp. | DRL | 2009-09-01 | 3.0 | 2009-10-01 | 3.42 | 14% |
| Pilgrim's Pride Corporation | PGPDQ | 2009-09-01 | 4.9 | 2009-10-01 | 6.6 | 34.69% |
| Jackson Hewitt Tax Service Inc | JTX | 2009-08-03 | 6.16 | 2009-10-01 | 4.76 | -22.73% |
| Innospec Inc. | IOSP | 2009-08-03 | 12.81 | 2009-09-01 | 13.39 | 4.53% |
| Alliance One International, In | AOI | 2009-08-03 | 4.06 | 2009-09-01 | 3.9 | -3.94% |
| XOMA Limited | XOMA | 2009-08-03 | 0.93 | 2009-09-01 | 0.86 | -7.53% |
| La-Z-Boy Incorporated | LZB | 2009-08-03 | 7.08 | 2009-09-01 | 8.2 | 15.82% |
| China North East Petroleum Hld | NEP | 2009-08-03 | 5.76 | 2009-09-01 | 4.66 | -19.1% |
| Monotype Imaging Holdings Inc. | TYPE | 2009-06-01 | 5.62 | 2009-09-01 | 8.45 | 50.36% |
| Universal Insurance Holdings, | UVE | 2009-06-01 | 5.09 | 2009-09-01 | 4.78 | -6.09% |
| Chesapeake Utilities | CPK | 2009-06-01 | 32.59 | 2009-09-01 | 30.4 | -6.72% |
| Republic Airways Holdings Inc. | RJET | 2009-06-01 | 5.93 | 2009-09-01 | 8.63 | 45.53% |
| Sonic Automotive, Inc. | SAH | 2009-07-01 | 10.16 | 2009-08-03 | 13.99 | 37.7% |
| Bolt Technology Corp. | BOLT | 2009-06-15 | 12.5 | 2009-08-03 | 11.72 | -6.24% |
| AEP Industries | AEPI | 2009-06-01 | 27.0 | 2009-08-03 | 33.43 | 23.81% |
| Blyth, Inc. | BTH | 2009-06-01 | 35.66 | 2009-08-03 | 43.89 | 23.08% |
| Angiotech Pharmaceuticals, Inc | ANPI | 2009-06-01 | 1.72 | 2009-08-03 | 1.68 | -2.33% |
| Apogee Enterprises, Inc. | APOG | 2009-05-04 | 13.48 | 2009-08-03 | 14.91 | 10.61% |
| Sealy Corporation | ZZ | 2009-05-04 | 4.5 | 2009-08-03 | 2.45 | -45.56% |
| Borders Group, Inc. | BGP | 2009-06-01 | 3.13 | 2009-07-01 | 3.65 | 16.61% |
| China North East Petroleum Hld | CNEH | 2009-06-01 | 4.62 | 2009-06-15 | 5.29 | 14.5% |
| HORSEHEAD HOLDING CORP. | ZINC | 2009-05-04 | 7.99 | 2009-06-01 | 7.77 | -2.75% |
| Jinpan International Limited | JST | 2009-05-04 | 20.84 | 2009-06-01 | 31.22 | 49.81% |
| Hawaiian Holdings, Inc. | HA | 2009-05-04 | 5.47 | 2009-06-01 | 5.4 | -1.28% |
| Exterran Partners, L.P. | EXLP | 2009-05-04 | 13.59 | 2009-06-01 | 13.73 | 1.03% |
| Parker Drilling Company | PKD | 2009-04-01 | 1.91 | 2009-06-01 | 5.3 | 177.49% |
| Advance America, Cash Advance | AEA | 2009-04-01 | 1.72 | 2009-06-01 | 4.64 | 169.77% |
| Impax Laboratories, Inc. | IPXL | 2009-04-01 | 5.27 | 2009-06-01 | 6.74 | 27.89% |
| Isle of Capri Casinos | ISLE | 2009-04-01 | 6.24 | 2009-06-01 | 13.42 | 115.06% |
| Elizabeth Arden, Inc. | RDEN | 2009-03-03 | 4.45 | 2009-06-01 | 7.38 | 65.84% |
| CIBER, Inc. | CBR | 2009-04-01 | 2.83 | 2009-05-04 | 3.31 | 16.96% |
| Unitil Corporation | UTL | 2009-04-01 | 19.87 | 2009-05-04 | 22.2 | 11.73% |
| Spartan Motors, Inc. | SPAR | 2009-04-01 | 4.1 | 2009-05-04 | 8.74 | 113.17% |
| Interline Brands, Inc. | IBI | 2009-04-01 | 8.43 | 2009-05-04 | 14.73 | 74.73% |
| Olympic Steel, Inc. | ZEUS | 2009-04-01 | 16.17 | 2009-05-04 | 21.57 | 33.4% |
| Capital Product Partners L.P. | CPLP | 2009-03-03 | 5.76 | 2009-05-04 | 9.96 | 72.92% |
| Metalico, Inc. | MEA | 2009-03-03 | 1.79 | 2009-04-01 | 1.81 | 1.12% |
| Callon Petroleum Company | CPE | 2009-03-03 | 1.07 | 2009-04-01 | 1.07 | 0% |
| Noven Pharmaceuticals, Inc. | NOVN | 2009-03-03 | 9.26 | 2009-04-01 | 10.12 | 9.29% |
| NGP Capital Resources Company | NGPC | 2009-02-02 | 8.38 | 2009-04-01 | 5.2 | -37.95% |
| Interface, Inc. | IFSIA | 2009-02-02 | 4.08 | 2009-04-01 | 3.06 | -25% |
| Anthracite Capital Inc. | AHR | 2009-01-02 | 2.49 | 2009-04-01 | 0.37 | -85.14% |
| School Specialty, Inc. | SCHS | 2009-01-02 | 19.78 | 2009-04-01 | 17.9 | -9.5% |
| Central Vermont Public Service | CV | 2009-01-02 | 23.98 | 2009-04-01 | 17.37 | -27.56% |
| Apogee Enterprises, Inc. | APOG | 2008-12-01 | 6.06 | 2009-04-01 | 11.1 | 83.17% |
| Andersons, Inc., The | ANDE | 2009-02-02 | 17.29 | 2009-03-03 | 11.41 | -34.01% |
| General Maritime Corporation | GMR | 2009-02-02 | 10.57 | 2009-03-03 | 8.13 | -23.08% |
| Maxygen, Inc. | MAXY | 2009-02-02 | 8.5 | 2009-03-03 | 6.96 | -18.12% |
| Stone Energy Corporation | SGY | 2009-02-02 | 8.2 | 2009-03-03 | 3.38 | -58.78% |
| NOVA Chemicals Corporation (US | NCX | 2009-01-02 | 5.07 | 2009-03-03 | 5.56 | 9.66% |
| Pioneer Southwest Energy Partn | PSE | 2009-01-02 | 14.3 | 2009-02-02 | 15.5 | 8.39% |
| Federal-Mogul Corporation | FDML | 2009-01-02 | 5.27 | 2009-02-02 | 5.92 | 12.33% |
| Saia Inc. | SAIA | 2008-12-01 | 8.47 | 2009-02-02 | 11.27 | 33.06% |
| Central Pacific Financial Corp | CPF | 2008-12-01 | 10.26 | 2009-02-02 | 7.07 | -31.09% |
| Alliance Imaging, Inc. | AIQ | 2008-11-03 | 8.18 | 2009-02-02 | 9.23 | 12.84% |
| Ennis, Inc. | EBF | 2008-08-01 | 15.87 | 2009-02-02 | 11.71 | -26.21% |
| Oxford Industries, Inc. | OXM | 2008-12-01 | 5.47 | 2009-01-02 | 9.07 | 65.81% |
| Energy Partners, Ltd. | EPL | 2008-12-01 | 2.76 | 2009-01-02 | 1.72 | -37.68% |
| Crosstex Energy, Inc. | XTXI | 2008-12-01 | 3.27 | 2009-01-02 | 3.89 | 18.96% |
| Epicor Software Corporation | EPIC | 2008-09-02 | 8.48 | 2009-01-02 | 4.8 | -43.4% |
| A. Schulman, Inc. | SHLM | 2008-09-02 | 23.84 | 2009-01-02 | 17.13 | -28.15% |
| McClatchy Company, The | MNI | 2008-09-02 | 3.18 | 2009-01-02 | 1.09 | -65.72% |
| ArvinMeritor, Inc. | ARM | 2008-11-03 | 5.54 | 2008-12-01 | 3.2 | -42.24% |
| Chesapeake Utilities | CPK | 2008-11-03 | 30.85 | 2008-12-01 | 27.47 | -10.96% |
| VAALCO Energy, Inc. | EGY | 2008-10-01 | 6.62 | 2008-12-01 | 6.84 | 3.32% |
| Greenbrier Companies, The | GBX | 2008-09-02 | 18.95 | 2008-12-01 | 6.05 | -68.07% |
| BGC Partners, Inc. | BGCP | 2008-09-02 | 6.16 | 2008-12-01 | 3.13 | -49.19% |
| Gibraltar Industries, Inc. | ROCK | 2008-08-01 | 15.31 | 2008-12-01 | 10.47 | -31.61% |
| SJW Corp. | SJW | 2008-10-01 | 29.13 | 2008-11-03 | 28.6 | -1.82% |
| American Oriental Bioengineeri | AOB | 2008-09-02 | 8.25 | 2008-11-03 | 6.24 | -24.36% |
| Rush Enterprises, Inc. | RUSHA | 2008-09-02 | 13.0 | 2008-11-03 | 9.42 | -27.54% |
| EnergySouth, Inc. | ENSI | 2008-09-02 | 61.1 | 2008-10-01 | 61.5 | 0.65% |
| Bolt Technology Corp. | BOLT | 2008-07-01 | 22.28 | 2008-10-01 | 13.99 | -37.21% |
| Furniture Brands International | FBN | 2008-08-01 | 11.76 | 2008-09-02 | 9.18 | -21.94% |
| Brightpoint, Inc. | CELL | 2008-08-01 | 6.95 | 2008-09-02 | 8.48 | 22.01% |
| Genesco Inc. | GCO | 2008-07-01 | 30.28 | 2008-09-02 | 37.02 | 22.26% |
| Omega Navigation Enterprises, | ONAV | 2008-06-02 | 19.88 | 2008-09-02 | 15.33 | -22.89% |
| CH Energy Group, Inc. | CHG | 2008-06-02 | 37.31 | 2008-09-02 | 39.85 | 6.81% |
| Innospec Inc. | IOSP | 2008-06-02 | 24.62 | 2008-09-02 | 15.31 | -37.81% |
| CompuCredit Corporation | CCRT | 2008-04-01 | 8.75 | 2008-09-02 | 5.17 | -40.91% |
| Par Pharmaceutical Companies, | PRX | 2008-04-01 | 17.91 | 2008-09-02 | 14.4 | -19.6% |
| Tecumseh Products Company | TECUA | 2008-06-02 | 36.27 | 2008-08-01 | 31.42 | -13.37% |
| SMART Modular Technologies (WW | SMOD | 2008-05-01 | 6.12 | 2008-08-01 | 3.84 | -37.25% |
| Helen of Troy Limited | HELE | 2008-02-01 | 17.37 | 2008-08-01 | 20.58 | 18.48% |
| Alliance One International, In | AOI | 2008-01-02 | 3.92 | 2008-08-01 | 4.48 | 14.29% |
| UTStarcom, Inc. | UTSI | 2008-06-02 | 4.86 | 2008-07-01 | 5.59 | 15.02% |
| North American Energy Partners | NOA | 2008-05-01 | 15.84 | 2008-07-01 | 20.71 | 30.74% |
| Air T Inc | AIRT | 2008-05-01 | 9.48 | 2008-06-02 | 9.04 | -4.64% |
| Central Vermont Public Service | CV | 2008-05-01 | 23.59 | 2008-06-02 | 20.28 | -14.03% |
| R.H. Donnelley Corporation | RHD | 2008-04-01 | 5.46 | 2008-06-02 | 5.35 | -2.01% |
| A.M. Castle & Co. | CAS | 2008-03-03 | 22.82 | 2008-06-02 | 32.03 | 40.36% |
| Comfort Systems USA, Inc. | FIX | 2007-09-04 | 14.86 | 2008-06-02 | 13.03 | -12.31% |
| Chesapeake Utilities | CPK | 2008-04-01 | 30.43 | 2008-05-01 | 29.35 | -3.55% |
| Wabtec Corporation | WAB | 2008-04-01 | 39.05 | 2008-05-01 | 43.28 | 10.83% |
| Global Industries, Ltd. | GLBL | 2008-04-01 | 16.18 | 2008-05-01 | 15.86 | -1.98% |
| GSI Commerce, Inc. | GSIC | 2008-04-01 | 13.62 | 2008-05-01 | 14.17 | 4.04% |
| Consolidated Water Co. Ltd. | CWCO | 2008-03-03 | 20.58 | 2008-04-01 | 23.15 | 12.49% |
| Credence Systems Corp. | CMOS | 2008-03-03 | 1.35 | 2008-04-01 | 1.78 | 31.85% |
| Centerline Holding Company | CHC | 2008-02-01 | 6.13 | 2008-04-01 | 4.21 | -31.32% |
| Six Flags, Inc. | SIX | 2008-02-01 | 1.99 | 2008-04-01 | 1.81 | -9.05% |
| Pacer International, Inc. | PACR | 2008-01-02 | 14.36 | 2008-04-01 | 17.49 | 21.8% |
| VIVUS, Inc. | VVUS | 2007-12-03 | 5.64 | 2008-04-01 | 6.17 | 9.4% |
| Newpark Resources, Inc. | NR | 2007-09-04 | 5.8 | 2008-04-01 | 5.1 | -12.07% |
| Universal Forest Products, Inc | UFPI | 2008-02-01 | 37.35 | 2008-03-03 | 28.16 | -24.61% |
| Intevac, Inc. | IVAC | 2008-02-01 | 11.44 | 2008-03-03 | 11.84 | 3.5% |
| Central Vermont Public Service | CV | 2007-12-03 | 26.41 | 2008-03-03 | 24.38 | -7.69% |
| School Specialty, Inc. | SCHS | 2007-12-03 | 35.46 | 2008-02-01 | 33.47 | -5.61% |
| Fremont General Corporation | FMT | 2007-12-03 | 2.32 | 2008-02-01 | 3.64 | 56.9% |
| Amerigon Incorporated | ARGN | 2007-11-01 | 18.71 | 2008-02-01 | 17.87 | -4.49% |
| Alaska Communications Systems | ALSK | 2007-11-01 | 15.05 | 2008-02-01 | 14.0 | -6.98% |
| Buckeye Technologies Inc. | BKI | 2007-06-01 | 14.46 | 2008-02-01 | 13.54 | -6.36% |
| Diamond Foods, Inc. | DMND | 2007-12-03 | 20.2 | 2008-01-02 | 21.23 | 5.1% |
| Mesa Air Group, Inc. | MESA | 2007-11-01 | 4.71 | 2008-01-02 | 3.0 | -36.31% |
| Raven Industries, Inc. | RAVN | 2007-10-01 | 40.7 | 2007-12-03 | 33.13 | -18.6% |
| Vital Signs, Inc. | VITL | 2007-10-01 | 54.84 | 2007-12-03 | 52.82 | -3.68% |
| FPIC Insurance Group, Inc. | FPIC | 2007-09-04 | 40.53 | 2007-12-03 | 40.63 | 0.25% |
| Lance, Inc. | LNCE | 2007-08-01 | 24.88 | 2007-12-03 | 20.4 | -18.01% |
| Laclede Group, Inc., The | LG | 2007-06-01 | 30.32 | 2007-12-03 | 34.13 | 12.57% |
| LSI Industries, Inc. | LYTS | 2007-09-04 | 20.76 | 2007-11-01 | 17.65 | -14.98% |
| Aftermarket Technology Corp. | ATAC | 2007-09-04 | 30.0 | 2007-11-01 | 32.38 | 7.93% |
| Air Methods Corporation | AIRM | 2007-09-04 | 39.99 | 2007-11-01 | 52.94 | 32.38% |
| Ultimate Software Group, Inc., | ULTI | 2007-09-04 | 31.39 | 2007-10-01 | 35.76 | 13.92% |
| Res-Care, Inc. | RSCR | 2007-06-01 | 20.91 | 2007-10-01 | 23.13 | 10.62% |
| American Physicians Capital, I | ACAP | 2007-08-01 | 38.0 | 2007-09-04 | 39.41 | 3.71% |
| EDO Corporation | EDO | 2007-08-01 | 33.68 | 2007-09-04 | 45.2 | 34.2% |
| Stratasys, Inc. | SSYS | 2007-08-01 | 23.2 | 2007-09-04 | 26.84 | 15.69% |
| Excel Maritime Carriers | EXM | 2007-06-01 | 23.74 | 2007-09-04 | 43.71 | 84.12% |
| Nash-Finch Company | NAFC | 2007-06-01 | 47.21 | 2007-09-04 | 37.4 | -20.78% |
| PetroQuest Energy, Inc. | PQ | 2007-06-01 | 14.52 | 2007-09-04 | 11.44 | -21.21% |
| Rush Enterprises, Inc. | RUSHA | 2007-06-01 | 16.63 | 2007-09-04 | 17.26 | 3.79% |
| Apogee Enterprises, Inc. | APOG | 2007-06-01 | 25.55 | 2007-08-01 | 26.52 | 3.8% |
| Darling International Inc. | DAR | 2007-06-01 | 9.2 | 2007-08-01 | 8.27 | -10.11% |
| Navigators Group, Inc, The | NAVG | 2007-06-01 | 49.97 | 2007-08-01 | 53.68 | 7.42% |
| Concur Technologies, Inc. | CNQR | 2007-06-01 | 19.9 | 2007-08-01 | 24.28 | 22.01% |
| Jaclyn Inc | JLN | 2007-04-02 | 11.19 | 2007-06-01 | 8.96 | -19.93% |
| Global Entertainment Corp | GEE | 2007-04-02 | 5.01 | 2007-06-01 | 4.9 | -2.2% |
| EMAK Worldwide Inc | EMAK | 2007-04-02 | 5.06 | 2007-06-01 | 2.87 | -43.28% |
| Central Natural Resources Inc | CTNR | 2007-04-02 | 32.77 | 2007-06-01 | 37.76 | 15.23% |
| Computer Horizons Corp | CHRZ | 2007-04-02 | 0.74 | 2007-06-01 | 0.7 | -5.41% |
| China Natural Resources Inc | CHNR | 2007-04-02 | 7.55 | 2007-06-01 | 7.2 | -4.64% |
| Basic Earth Science SYS Inc | BSIC | 2007-04-02 | 1.62 | 2007-06-01 | 1.44 | -11.11% |
| Coffee Holding Co Inc | JVA | 2007-04-02 | 3.9 | 2007-06-01 | 3.95 | 1.28% |
| Emerson Radio Corp | MSN | 2007-04-02 | 3.18 | 2007-06-01 | 3.24 | 1.89% |
| Graham Corp | GHM | 2007-04-02 | 16.16 | 2007-06-01 | 17.48 | 8.17% |
| Ziegler Cos Inc/The | ZGCO | 2007-04-02 | 30.0 | 2007-06-01 | 31.25 | 4.17% |
| US 1 Industries Inc | USOO | 2007-04-02 | 1.87 | 2007-06-01 | 1.41 | -24.6% |
| Target Logistics Inc | TLG | 2007-04-02 | 2.47 | 2007-06-01 | 2.03 | -17.81% |
| Tandy Brands Accessories Inc | TBAC | 2007-04-02 | 12.9 | 2007-06-01 | 12.31 | -4.57% |
| Security National Financial Corp | SNFCA | 2007-04-02 | 4.95 | 2007-06-01 | 5.88 | 18.79% |
| RedEnvelope Inc | REDE | 2007-04-02 | 8.0 | 2007-06-01 | 6.94 | -13.25% |
| QEP Co Inc | QEPC | 2007-04-02 | 6.29 | 2007-06-01 | 6.48 | 3.02% |
| Bio-Imaging Technologies Inc | BITI | 2007-04-02 | 6.24 | 2007-06-01 | 7.01 | 12.34% |
| Asia Pacific Wire & Cable | AWRCF | 2007-04-02 | 3.75 | 2007-06-01 | 3.4 | -9.33% |
| Advocat Inc | AVCA | 2007-04-02 | 12.25 | 2007-06-01 | 12.54 | 2.37% |
| American Homepatient Inc | AHOM | 2007-04-02 | 2.7 | 2007-06-01 | 2.59 | -4.07% |
| Acme United Corp | ACU | 2007-04-02 | 14.19 | 2007-06-01 | 14.54 | 2.47% |
| Conrad Industries Inc | CNRD | 2007-01-03 | 6.24 | 2007-06-01 | 13.0 | 108.33% |
| Pioneer Oil & Gas | POGS | 2007-01-03 | 1.5 | 2007-06-01 | 1.93 | 28.67% |
| Armstrong Holdings Inc | ACKH | 2007-01-03 | 0.32 | 2007-06-01 | 0.64 | 100% |
| Five Star Products Inc | FSPX | 2007-01-03 | 0.34 | 2007-06-01 | 0.66 | 94.12% |
| Big Rock Brewery Income Trust | BRBMF | 2007-01-03 | 11.7 | 2007-06-01 | 17.04 | 45.64% |
| TMSF Holdings Inc | TMFZ | 2006-10-02 | 1.2 | 2007-06-01 | 0.45 | -62.5% |
| ePlus Inc | PLUS | 2006-10-02 | 10.46 | 2007-06-01 | 9.77 | -6.6% |
| Paul Mueller Co | MUEL | 2006-07-03 | 33.41 | 2007-06-01 | 57.83 | 73.09% |
| Communicate.com Inc | CMNN | 2007-01-03 | 1.34 | 2007-04-02 | 1.08 | -19.4% |
| Comdisco Holding Co Inc | CDCO | 2007-01-03 | 11.4 | 2007-04-02 | 12.5 | 9.65% |
| En Pointe Technologies Inc | ENPT | 2007-01-03 | 4.56 | 2007-04-02 | 3.33 | -26.97% |
| BIW Ltd | BIW | 2007-01-03 | 15.32 | 2007-04-02 | 16.77 | 9.46% |
| American Shared Hospital Services | AMS | 2007-01-03 | 6.57 | 2007-04-02 | 5.83 | -11.26% |
| Superior Uniform Group Inc | SGC | 2007-01-03 | 12.16 | 2007-04-02 | 12.48 | 2.63% |
| Encorium Group Inc | ENCO | 2007-01-03 | 5.15 | 2007-04-02 | 3.51 | -31.84% |
| Remec Inc | REMC | 2007-01-03 | 1.35 | 2007-04-02 | 1.52 | 12.59% |
| Sterling Chemicals Inc | SCHI | 2007-01-03 | 12.75 | 2007-04-02 | 10.98 | -13.88% |
| Vermont Pure Holdings Ltd | VPS | 2007-01-03 | 1.54 | 2007-04-02 | 1.9 | 23.38% |
| Pioneer Railcorp | PRRR | 2007-01-03 | 3.51 | 2007-04-02 | 3.82 | 8.83% |
| US Home Systems Inc | USHS | 2007-01-03 | 11.81 | 2007-04-02 | 12.69 | 7.45% |
| Natural Alternatives International Inc | NAII | 2007-01-03 | 8.83 | 2007-04-02 | 8.11 | -8.15% |
| Meadow Valley Corp | MVCO | 2007-01-03 | 10.31 | 2007-04-02 | 13.2 | 28.03% |
| MicroFinancial Inc | MFI | 2007-01-03 | 3.77 | 2007-04-02 | 5.09 | 35.01% |
| MC Shipping Inc | MCX | 2007-01-03 | 9.12 | 2007-04-02 | 10.24 | 12.28% |
| Redhook ALE Brewery Inc | HOOK | 2007-01-03 | 5.0 | 2007-04-02 | 7.3 | 46% |
| P&F Industries | PFIN | 2006-10-02 | 10.1 | 2007-04-02 | 11.99 | 18.71% |
| Magellan Petroleum Corp | MPET | 2006-10-02 | 1.31 | 2007-04-02 | 1.38 | 5.34% |
| Coast Distribution System/CA | CRV | 2006-10-02 | 8.94 | 2007-04-02 | 7.57 | -15.32% |
| TeamStaff Inc | TSTF | 2006-10-02 | 1.31 | 2007-04-02 | 1.18 | -9.92% |
| Constar International Inc | CNST | 2006-10-02 | 5.99 | 2007-04-02 | 8.78 | 46.58% |
| Florida Public Utilities Co | FPU | 2006-10-02 | 13.28 | 2007-04-02 | 12.3 | -7.38% |
| Commerce Energy Group Inc | EGR | 2006-10-02 | 1.37 | 2007-01-03 | 1.46 | 6.57% |
| Factory Card & Party Outlet Corp | FCPO | 2006-10-02 | 8.54 | 2007-01-03 | 8.01 | -6.21% |
| UFP Technologies Inc | UFPT | 2006-10-02 | 5.15 | 2007-01-03 | 5.64 | 9.51% |
| Bexil Corp | BXL | 2006-10-02 | 26.12 | 2007-01-03 | 33.0 | 26.34% |
| Basic Earth Science SYS Inc | BSIC | 2006-10-02 | 1.85 | 2007-01-03 | 1.86 | 0.54% |
| Asia Pacific Wire & Cable | AWRCF | 2006-10-02 | 2.65 | 2007-01-03 | 2.6 | -1.89% |
| Air T Inc | AIRT | 2006-10-02 | 9.51 | 2007-01-03 | 8.56 | -9.99% |
| Goldfield Corp | GV | 2006-10-02 | 1.06 | 2007-01-03 | 1.24 | 16.98% |
| Integramed America Inc | INMD | 2006-10-02 | 7.4 | 2007-01-03 | 11.82 | 59.73% |
| Smithway Motor Xpress Corp | SMXC | 2006-10-02 | 7.91 | 2007-01-03 | 10.16 | 28.45% |
| Tasty Baking Co | TSTY | 2006-10-02 | 8.61 | 2007-01-03 | 8.96 | 4.07% |
| Inventure Group Inc/The | SNAK | 2006-10-02 | 2.4 | 2007-01-03 | 2.41 | 0.42% |
| Interep National Radio Sales Inc | IREP | 2006-10-02 | 0.45 | 2007-01-03 | 0.3 | -33.33% |
| Overhill Farms Inc | OFI | 2006-10-02 | 3.16 | 2007-01-03 | 2.92 | -7.59% |
| National Home Health Care Corp | NHHC | 2006-10-02 | 9.53 | 2007-01-03 | 10.97 | 15.11% |
| Memry Corp | MRY | 2006-10-02 | 1.97 | 2007-01-03 | 2.3 | 16.75% |
| Lesco Inc | LSCO | 2006-10-02 | 8.26 | 2007-01-03 | 8.7 | 5.33% |
| Lazare Kaplan International Inc | LKI | 2006-10-02 | 9.65 | 2007-01-03 | 10.95 | 13.47% |
| Energy West Inc | EWST | 2006-07-03 | 8.34 | 2007-01-03 | 10.56 | 26.62% |
| Aspen Exploration Corp | ASPN | 2006-07-03 | 4.76 | 2007-01-03 | 2.58 | -45.8% |
| American Income Fund Inc | MRF | 2006-07-03 | 7.05 | 2007-01-03 | 7.62 | 8.09% |
| AirNet Systems Inc | ANS | 2006-07-03 | 2.99 | 2007-01-03 | 2.91 | -2.68% |
| AP Pharma Inc | APPA | 2006-07-03 | 6.0 | 2006-10-02 | 4.8 | -20% |
| Abatix Corp | ABIX | 2006-07-03 | 8.11 | 2006-10-02 | 7.18 | -11.47% |
| Everlast Worldwide Inc | EVST | 2006-07-03 | 13.57 | 2006-10-02 | 14.69 | 8.25% |
| Equus Total Return Inc | EQS | 2006-07-03 | 6.59 | 2006-10-02 | 6.97 | 5.77% |
| E Com Ventures Inc | ECMV | 2006-07-03 | 15.46 | 2006-10-02 | 12.35 | -20.12% |
| Datamirror Corp | DMCX | 2006-07-03 | 9.65 | 2006-10-02 | 10.5 | 8.81% |
| Delta Natural Gas Co Inc | DGAS | 2006-07-03 | 22.77 | 2006-10-02 | 23.8 | 4.52% |
| CCA Industries Inc | CAW | 2006-07-03 | 8.91 | 2006-10-02 | 9.25 | 3.82% |
| Bridgford Foods Corp | BRID | 2006-07-03 | 6.1 | 2006-10-02 | 6.24 | 2.3% |
| Alpine Group Inc | APNI | 2006-07-03 | 3.1 | 2006-10-02 | 2.55 | -17.74% |
| RGC Resources Inc | RGCO | 2006-07-03 | 23.5 | 2006-10-02 | 24.44 | 4% |
| Lakeland Industries Inc | LAKE | 2006-07-03 | 13.81 | 2006-10-02 | 12.35 | -10.57% |
| Isramco Inc | ISRL | 2006-07-03 | 17.0 | 2006-10-02 | 17.74 | 4.35% |
| International Shipholding Corp | ISH | 2006-07-03 | 13.29 | 2006-10-02 | 12.47 | -6.17% |
| Arabian American Development Co | ARSD | 2006-07-03 | 1.75 | 2006-10-02 | 3.06 | 74.86% |
| Zones Inc | ZONS | 2006-07-03 | 6.45 | 2006-10-02 | 12.0 | 86.05% |
| US 1 Industries Inc | USOO | 2006-07-03 | 1.95 | 2006-10-02 | 1.3 | -33.33% |
| Taseko Mines Ltd | TGB | 2006-07-03 | 2.78 | 2006-10-02 | 2.19 | -21.22% |
| Security National Financial Corp | SNFCA | 2006-07-03 | 4.22 | 2006-10-02 | 4.12 | -2.37% |
| Rocky Mountain Chocolate Factory Inc | RMCF | 2006-07-03 | 11.98 | 2006-10-02 | 12.7 | 6.01% |
| Radiologix Inc | RGX | 2006-07-03 | 2.25 | 2006-10-02 | 4.07 | 80.89% |
| Penton Media Inc | PTON | 2006-07-03 | 0.29 | 2006-10-02 | 0.55 | 89.66% |
| Foamex International Inc | FMXIQ | 2006-07-03 | 3.56 | 2006-10-02 | 3.75 | 5.34% |
| Exxel Energy Corp | EXX.A | 2006-07-03 | 2.55 | 2006-10-02 | 3.1 | 21.57% |
| Emerson Radio Corp | MSN | 2006-07-03 | 3.26 | 2006-10-02 | 3.03 | -7.06% |
| Friedman Industries | FRD | 2006-07-03 | 9.29 | 2006-10-02 | 7.99 | -13.99% |

Click the following link to watch the tutorial about how to use the model stock portfolios:
Please note that all recommendations are based on our model's results and do not represent our personal opinion. The stock Rating process is purely mechanical.
All analysis relies on publicly available financial information. Learn More